Dominican vs Immigrants from Panama 9th Grade
COMPARE
Dominican
Immigrants from Panama
9th Grade
9th Grade Comparison
Dominicans
Immigrants from Panama
91.1%
9TH GRADE
0.0/ 100
METRIC RATING
328th/ 347
METRIC RANK
94.3%
9TH GRADE
4.0/ 100
METRIC RATING
231st/ 347
METRIC RANK
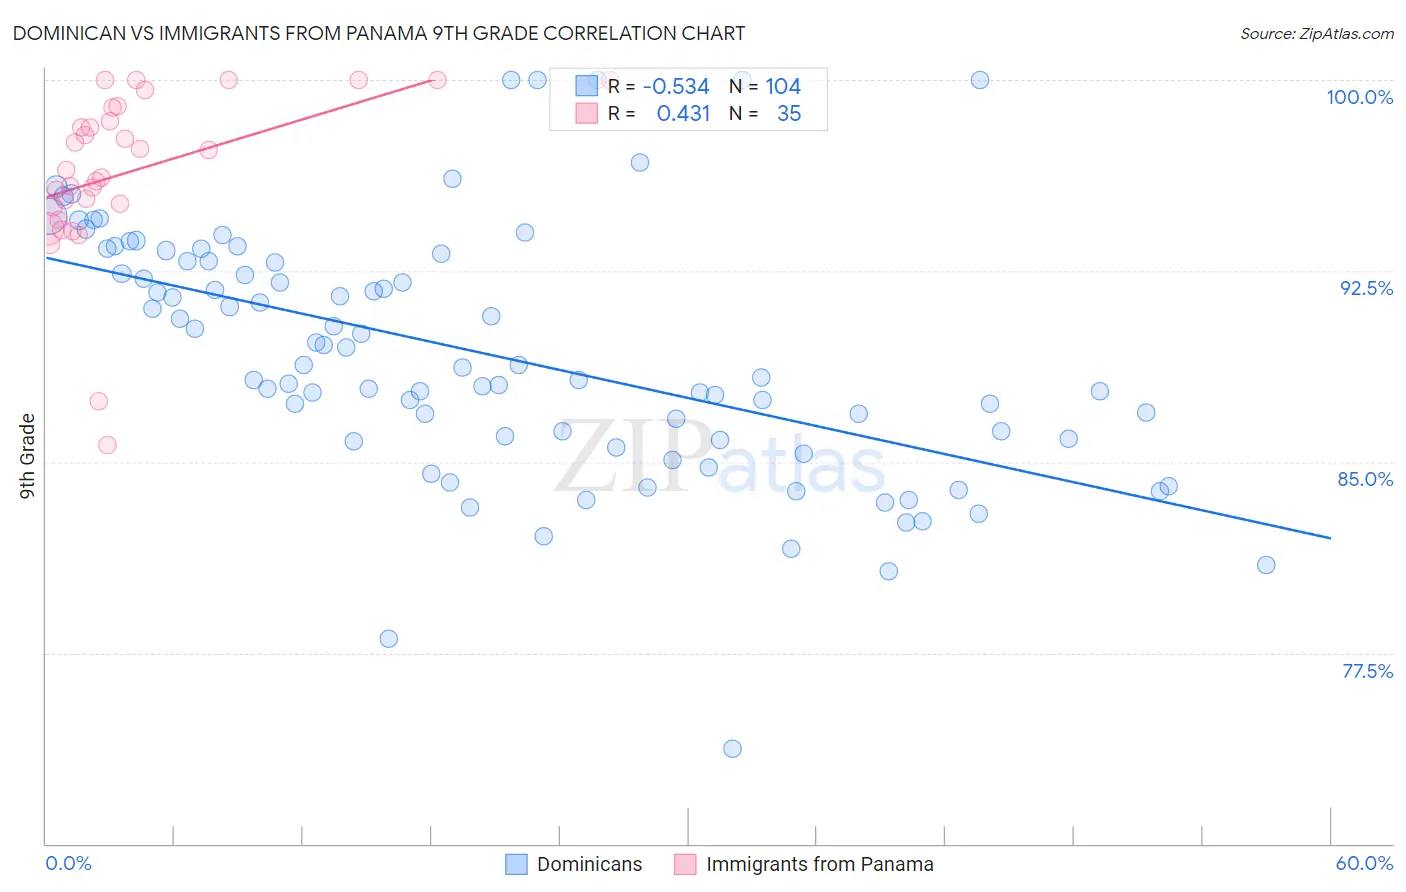
Dominican vs Immigrants from Panama 9th Grade Correlation Chart
The statistical analysis conducted on geographies consisting of 355,142,452 people shows a substantial negative correlation between the proportion of Dominicans and percentage of population with at least 9th grade education in the United States with a correlation coefficient (R) of -0.534 and weighted average of 91.1%. Similarly, the statistical analysis conducted on geographies consisting of 221,183,192 people shows a moderate positive correlation between the proportion of Immigrants from Panama and percentage of population with at least 9th grade education in the United States with a correlation coefficient (R) of 0.431 and weighted average of 94.3%, a difference of 3.6%.
9th Grade Correlation Summary
| Measurement | Dominican | Immigrants from Panama |
| Minimum | 73.7% | 85.7% |
| Maximum | 100.0% | 100.0% |
| Range | 26.3% | 14.3% |
| Mean | 89.2% | 96.4% |
| Median | 88.7% | 96.5% |
| Interquartile 25% (IQ1) | 85.9% | 95.0% |
| Interquartile 75% (IQ3) | 92.9% | 98.9% |
| Interquartile Range (IQR) | 7.0% | 3.9% |
| Standard Deviation (Sample) | 4.9% | 3.2% |
| Standard Deviation (Population) | 4.9% | 3.2% |
Similar Demographics by 9th Grade
Demographics Similar to Dominicans by 9th Grade
In terms of 9th grade, the demographic groups most similar to Dominicans are Honduran (91.0%, a difference of 0.030%), Immigrants from Cabo Verde (90.9%, a difference of 0.15%), Mexican American Indian (90.9%, a difference of 0.18%), Hispanic or Latino (90.9%, a difference of 0.20%), and Immigrants from Yemen (90.8%, a difference of 0.29%).
| Demographics | Rating | Rank | 9th Grade |
| Immigrants | Ecuador | 0.0 /100 | #321 | Tragic 91.8% |
| Belizeans | 0.0 /100 | #322 | Tragic 91.8% |
| Puerto Ricans | 0.0 /100 | #323 | Tragic 91.8% |
| Immigrants | Belize | 0.0 /100 | #324 | Tragic 91.8% |
| Central American Indians | 0.0 /100 | #325 | Tragic 91.5% |
| Immigrants | Armenia | 0.0 /100 | #326 | Tragic 91.4% |
| Immigrants | Nicaragua | 0.0 /100 | #327 | Tragic 91.3% |
| Dominicans | 0.0 /100 | #328 | Tragic 91.1% |
| Hondurans | 0.0 /100 | #329 | Tragic 91.0% |
| Immigrants | Cabo Verde | 0.0 /100 | #330 | Tragic 90.9% |
| Mexican American Indians | 0.0 /100 | #331 | Tragic 90.9% |
| Hispanics or Latinos | 0.0 /100 | #332 | Tragic 90.9% |
| Immigrants | Yemen | 0.0 /100 | #333 | Tragic 90.8% |
| Immigrants | Azores | 0.0 /100 | #334 | Tragic 90.8% |
| Immigrants | Honduras | 0.0 /100 | #335 | Tragic 90.6% |
Demographics Similar to Immigrants from Panama by 9th Grade
In terms of 9th grade, the demographic groups most similar to Immigrants from Panama are Apache (94.3%, a difference of 0.010%), Immigrants from Africa (94.3%, a difference of 0.010%), Immigrants from Southern Europe (94.3%, a difference of 0.020%), Nigerian (94.3%, a difference of 0.020%), and Costa Rican (94.3%, a difference of 0.020%).
| Demographics | Rating | Rank | 9th Grade |
| Tongans | 6.0 /100 | #224 | Tragic 94.4% |
| Ethiopians | 5.4 /100 | #225 | Tragic 94.4% |
| Sub-Saharan Africans | 5.4 /100 | #226 | Tragic 94.4% |
| Immigrants | Sierra Leone | 4.8 /100 | #227 | Tragic 94.4% |
| Lumbee | 4.7 /100 | #228 | Tragic 94.4% |
| Immigrants | Southern Europe | 4.5 /100 | #229 | Tragic 94.3% |
| Apache | 4.2 /100 | #230 | Tragic 94.3% |
| Immigrants | Panama | 4.0 /100 | #231 | Tragic 94.3% |
| Immigrants | Africa | 3.9 /100 | #232 | Tragic 94.3% |
| Nigerians | 3.7 /100 | #233 | Tragic 94.3% |
| Costa Ricans | 3.5 /100 | #234 | Tragic 94.3% |
| Bolivians | 3.3 /100 | #235 | Tragic 94.3% |
| Somalis | 2.9 /100 | #236 | Tragic 94.3% |
| Koreans | 2.9 /100 | #237 | Tragic 94.3% |
| South American Indians | 2.8 /100 | #238 | Tragic 94.3% |