Dominican vs Immigrants from Latvia 9th Grade
COMPARE
Dominican
Immigrants from Latvia
9th Grade
9th Grade Comparison
Dominicans
Immigrants from Latvia
91.1%
9TH GRADE
0.0/ 100
METRIC RATING
328th/ 347
METRIC RANK
95.6%
9TH GRADE
98.7/ 100
METRIC RATING
94th/ 347
METRIC RANK
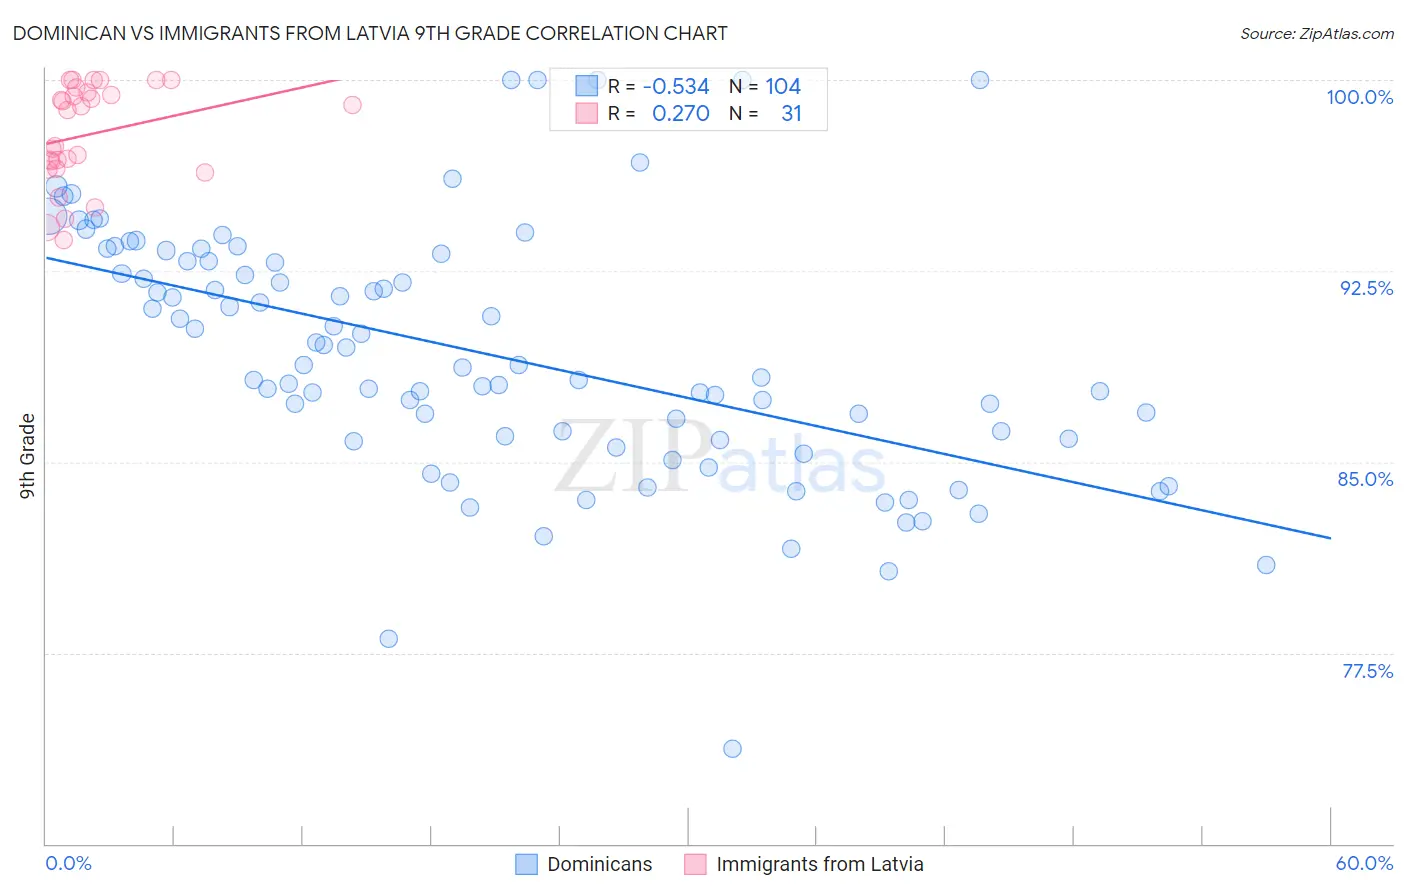
Dominican vs Immigrants from Latvia 9th Grade Correlation Chart
The statistical analysis conducted on geographies consisting of 355,142,452 people shows a substantial negative correlation between the proportion of Dominicans and percentage of population with at least 9th grade education in the United States with a correlation coefficient (R) of -0.534 and weighted average of 91.1%. Similarly, the statistical analysis conducted on geographies consisting of 113,735,345 people shows a weak positive correlation between the proportion of Immigrants from Latvia and percentage of population with at least 9th grade education in the United States with a correlation coefficient (R) of 0.270 and weighted average of 95.6%, a difference of 5.0%.
9th Grade Correlation Summary
| Measurement | Dominican | Immigrants from Latvia |
| Minimum | 73.7% | 93.7% |
| Maximum | 100.0% | 100.0% |
| Range | 26.3% | 6.3% |
| Mean | 89.2% | 97.9% |
| Median | 88.7% | 98.8% |
| Interquartile 25% (IQ1) | 85.9% | 96.5% |
| Interquartile 75% (IQ3) | 92.9% | 99.5% |
| Interquartile Range (IQR) | 7.0% | 3.0% |
| Standard Deviation (Sample) | 4.9% | 2.0% |
| Standard Deviation (Population) | 4.9% | 1.9% |
Similar Demographics by 9th Grade
Demographics Similar to Dominicans by 9th Grade
In terms of 9th grade, the demographic groups most similar to Dominicans are Honduran (91.0%, a difference of 0.030%), Immigrants from Cabo Verde (90.9%, a difference of 0.15%), Mexican American Indian (90.9%, a difference of 0.18%), Hispanic or Latino (90.9%, a difference of 0.20%), and Immigrants from Yemen (90.8%, a difference of 0.29%).
| Demographics | Rating | Rank | 9th Grade |
| Immigrants | Ecuador | 0.0 /100 | #321 | Tragic 91.8% |
| Belizeans | 0.0 /100 | #322 | Tragic 91.8% |
| Puerto Ricans | 0.0 /100 | #323 | Tragic 91.8% |
| Immigrants | Belize | 0.0 /100 | #324 | Tragic 91.8% |
| Central American Indians | 0.0 /100 | #325 | Tragic 91.5% |
| Immigrants | Armenia | 0.0 /100 | #326 | Tragic 91.4% |
| Immigrants | Nicaragua | 0.0 /100 | #327 | Tragic 91.3% |
| Dominicans | 0.0 /100 | #328 | Tragic 91.1% |
| Hondurans | 0.0 /100 | #329 | Tragic 91.0% |
| Immigrants | Cabo Verde | 0.0 /100 | #330 | Tragic 90.9% |
| Mexican American Indians | 0.0 /100 | #331 | Tragic 90.9% |
| Hispanics or Latinos | 0.0 /100 | #332 | Tragic 90.9% |
| Immigrants | Yemen | 0.0 /100 | #333 | Tragic 90.8% |
| Immigrants | Azores | 0.0 /100 | #334 | Tragic 90.8% |
| Immigrants | Honduras | 0.0 /100 | #335 | Tragic 90.6% |
Demographics Similar to Immigrants from Latvia by 9th Grade
In terms of 9th grade, the demographic groups most similar to Immigrants from Latvia are Immigrants from Germany (95.6%, a difference of 0.0%), Creek (95.6%, a difference of 0.010%), Immigrants from Saudi Arabia (95.6%, a difference of 0.010%), South African (95.6%, a difference of 0.020%), and American (95.6%, a difference of 0.020%).
| Demographics | Rating | Rank | 9th Grade |
| Okinawans | 99.0 /100 | #87 | Exceptional 95.7% |
| Immigrants | Czechoslovakia | 98.9 /100 | #88 | Exceptional 95.7% |
| Yugoslavians | 98.9 /100 | #89 | Exceptional 95.7% |
| South Africans | 98.8 /100 | #90 | Exceptional 95.6% |
| Creek | 98.8 /100 | #91 | Exceptional 95.6% |
| Immigrants | Saudi Arabia | 98.8 /100 | #92 | Exceptional 95.6% |
| Immigrants | Germany | 98.7 /100 | #93 | Exceptional 95.6% |
| Immigrants | Latvia | 98.7 /100 | #94 | Exceptional 95.6% |
| Americans | 98.5 /100 | #95 | Exceptional 95.6% |
| Filipinos | 98.5 /100 | #96 | Exceptional 95.6% |
| Delaware | 98.4 /100 | #97 | Exceptional 95.6% |
| Immigrants | Japan | 98.4 /100 | #98 | Exceptional 95.6% |
| Menominee | 98.3 /100 | #99 | Exceptional 95.6% |
| Lebanese | 98.1 /100 | #100 | Exceptional 95.6% |
| Immigrants | Moldova | 97.9 /100 | #101 | Exceptional 95.5% |