Dominican vs Immigrants from Bolivia 9th Grade
COMPARE
Dominican
Immigrants from Bolivia
9th Grade
9th Grade Comparison
Dominicans
Immigrants from Bolivia
91.1%
9TH GRADE
0.0/ 100
METRIC RATING
328th/ 347
METRIC RANK
93.9%
9TH GRADE
0.3/ 100
METRIC RATING
268th/ 347
METRIC RANK
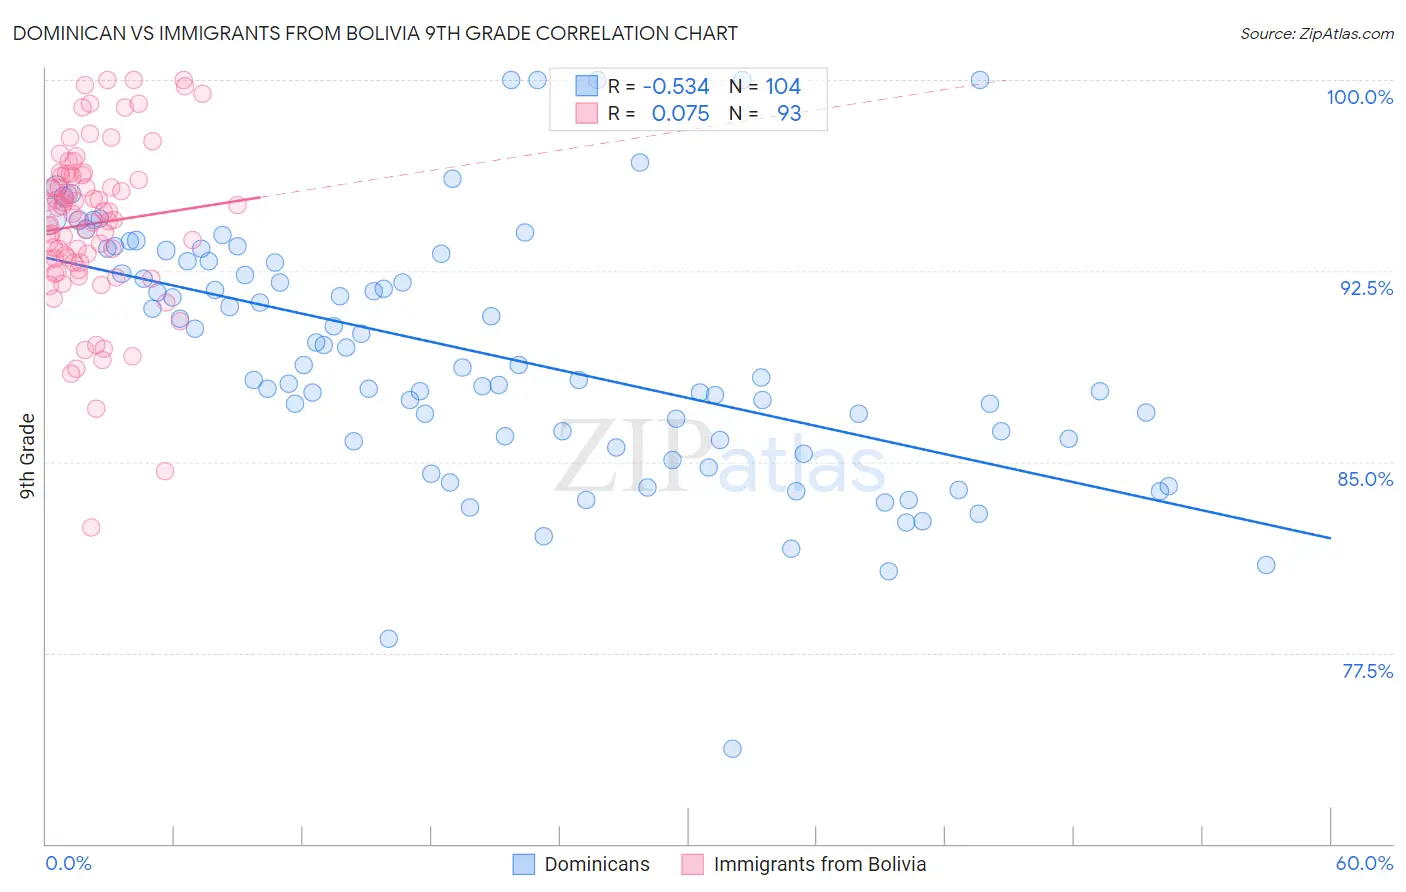
Dominican vs Immigrants from Bolivia 9th Grade Correlation Chart
The statistical analysis conducted on geographies consisting of 355,142,452 people shows a substantial negative correlation between the proportion of Dominicans and percentage of population with at least 9th grade education in the United States with a correlation coefficient (R) of -0.534 and weighted average of 91.1%. Similarly, the statistical analysis conducted on geographies consisting of 158,727,043 people shows a slight positive correlation between the proportion of Immigrants from Bolivia and percentage of population with at least 9th grade education in the United States with a correlation coefficient (R) of 0.075 and weighted average of 93.9%, a difference of 3.1%.
9th Grade Correlation Summary
| Measurement | Dominican | Immigrants from Bolivia |
| Minimum | 73.7% | 82.4% |
| Maximum | 100.0% | 100.0% |
| Range | 26.3% | 17.6% |
| Mean | 89.2% | 94.3% |
| Median | 88.7% | 94.7% |
| Interquartile 25% (IQ1) | 85.9% | 92.8% |
| Interquartile 75% (IQ3) | 92.9% | 96.2% |
| Interquartile Range (IQR) | 7.0% | 3.4% |
| Standard Deviation (Sample) | 4.9% | 3.2% |
| Standard Deviation (Population) | 4.9% | 3.2% |
Similar Demographics by 9th Grade
Demographics Similar to Dominicans by 9th Grade
In terms of 9th grade, the demographic groups most similar to Dominicans are Honduran (91.0%, a difference of 0.030%), Immigrants from Cabo Verde (90.9%, a difference of 0.15%), Mexican American Indian (90.9%, a difference of 0.18%), Hispanic or Latino (90.9%, a difference of 0.20%), and Immigrants from Yemen (90.8%, a difference of 0.29%).
| Demographics | Rating | Rank | 9th Grade |
| Immigrants | Ecuador | 0.0 /100 | #321 | Tragic 91.8% |
| Belizeans | 0.0 /100 | #322 | Tragic 91.8% |
| Puerto Ricans | 0.0 /100 | #323 | Tragic 91.8% |
| Immigrants | Belize | 0.0 /100 | #324 | Tragic 91.8% |
| Central American Indians | 0.0 /100 | #325 | Tragic 91.5% |
| Immigrants | Armenia | 0.0 /100 | #326 | Tragic 91.4% |
| Immigrants | Nicaragua | 0.0 /100 | #327 | Tragic 91.3% |
| Dominicans | 0.0 /100 | #328 | Tragic 91.1% |
| Hondurans | 0.0 /100 | #329 | Tragic 91.0% |
| Immigrants | Cabo Verde | 0.0 /100 | #330 | Tragic 90.9% |
| Mexican American Indians | 0.0 /100 | #331 | Tragic 90.9% |
| Hispanics or Latinos | 0.0 /100 | #332 | Tragic 90.9% |
| Immigrants | Yemen | 0.0 /100 | #333 | Tragic 90.8% |
| Immigrants | Azores | 0.0 /100 | #334 | Tragic 90.8% |
| Immigrants | Honduras | 0.0 /100 | #335 | Tragic 90.6% |
Demographics Similar to Immigrants from Bolivia by 9th Grade
In terms of 9th grade, the demographic groups most similar to Immigrants from Bolivia are Armenian (93.9%, a difference of 0.020%), Navajo (93.9%, a difference of 0.030%), Immigrants from Congo (93.9%, a difference of 0.040%), Native/Alaskan (93.9%, a difference of 0.040%), and Immigrants from Uruguay (93.8%, a difference of 0.040%).
| Demographics | Rating | Rank | 9th Grade |
| South Americans | 0.4 /100 | #261 | Tragic 93.9% |
| Immigrants | Jamaica | 0.4 /100 | #262 | Tragic 93.9% |
| Immigrants | Uzbekistan | 0.4 /100 | #263 | Tragic 93.9% |
| Immigrants | Congo | 0.4 /100 | #264 | Tragic 93.9% |
| Natives/Alaskans | 0.4 /100 | #265 | Tragic 93.9% |
| Navajo | 0.3 /100 | #266 | Tragic 93.9% |
| Armenians | 0.3 /100 | #267 | Tragic 93.9% |
| Immigrants | Bolivia | 0.3 /100 | #268 | Tragic 93.9% |
| Immigrants | Uruguay | 0.2 /100 | #269 | Tragic 93.8% |
| Yuman | 0.2 /100 | #270 | Tragic 93.8% |
| Immigrants | Ghana | 0.2 /100 | #271 | Tragic 93.8% |
| Immigrants | Western Africa | 0.2 /100 | #272 | Tragic 93.8% |
| Immigrants | South America | 0.2 /100 | #273 | Tragic 93.8% |
| Peruvians | 0.2 /100 | #274 | Tragic 93.8% |
| Immigrants | Colombia | 0.2 /100 | #275 | Tragic 93.8% |