Nicaraguan vs Luxembourger Associate's Degree
COMPARE
Nicaraguan
Luxembourger
Associate's Degree
Associate's Degree Comparison
Nicaraguans
Luxembourgers
41.5%
ASSOCIATE'S DEGREE
0.4/ 100
METRIC RATING
261st/ 347
METRIC RANK
48.9%
ASSOCIATE'S DEGREE
95.1/ 100
METRIC RATING
115th/ 347
METRIC RANK
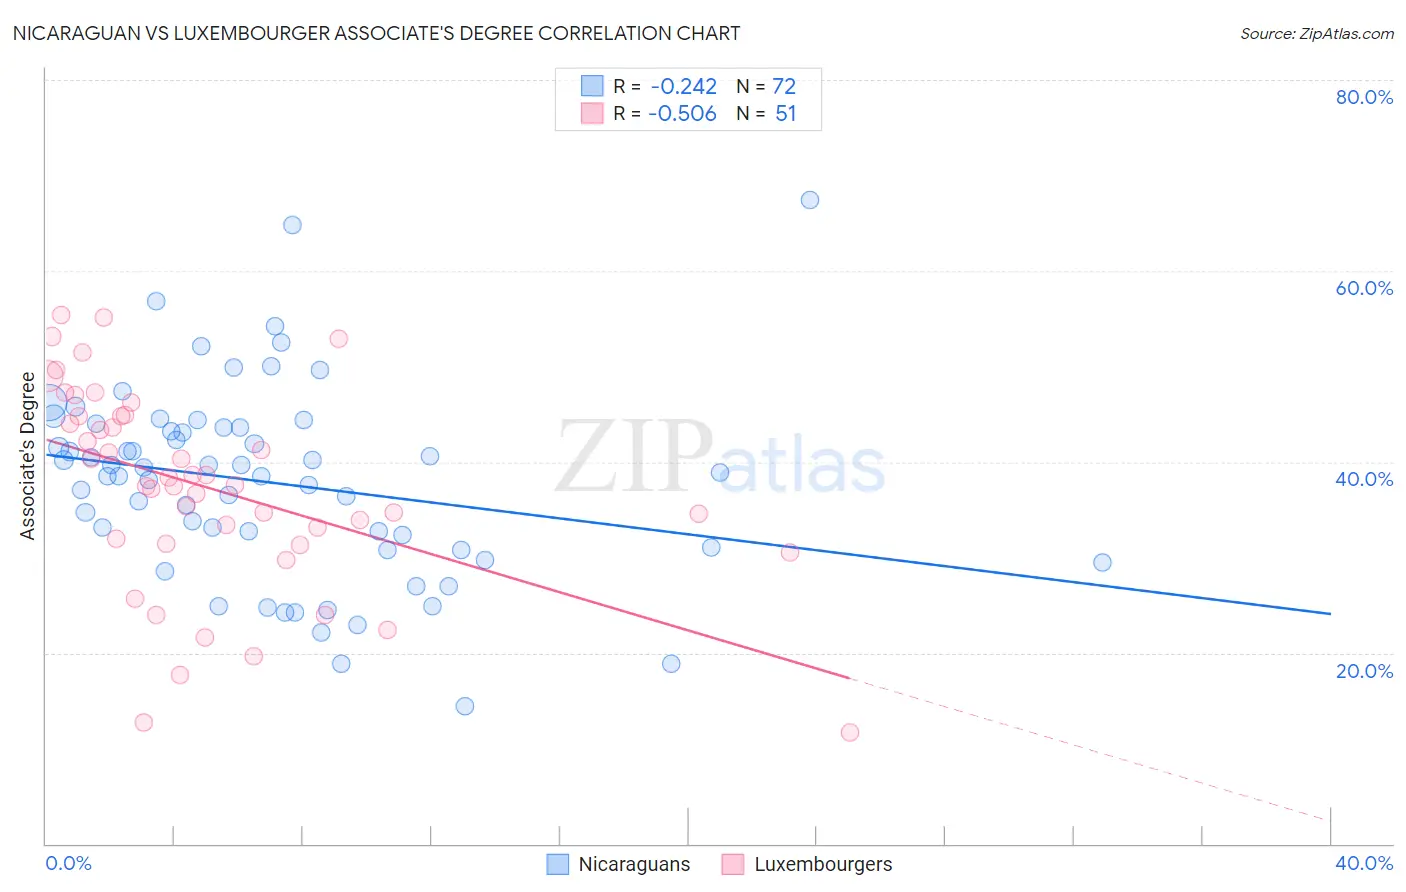
Nicaraguan vs Luxembourger Associate's Degree Correlation Chart
The statistical analysis conducted on geographies consisting of 285,707,386 people shows a weak negative correlation between the proportion of Nicaraguans and percentage of population with at least associate's degree education in the United States with a correlation coefficient (R) of -0.242 and weighted average of 41.5%. Similarly, the statistical analysis conducted on geographies consisting of 144,669,257 people shows a substantial negative correlation between the proportion of Luxembourgers and percentage of population with at least associate's degree education in the United States with a correlation coefficient (R) of -0.506 and weighted average of 48.9%, a difference of 17.9%.
Associate's Degree Correlation Summary
| Measurement | Nicaraguan | Luxembourger |
| Minimum | 14.4% | 11.7% |
| Maximum | 67.4% | 55.4% |
| Range | 53.0% | 43.7% |
| Mean | 37.8% | 37.3% |
| Median | 38.7% | 37.6% |
| Interquartile 25% (IQ1) | 30.9% | 31.5% |
| Interquartile 75% (IQ3) | 43.6% | 44.8% |
| Interquartile Range (IQR) | 12.7% | 13.3% |
| Standard Deviation (Sample) | 10.2% | 10.5% |
| Standard Deviation (Population) | 10.1% | 10.4% |
Similar Demographics by Associate's Degree
Demographics Similar to Nicaraguans by Associate's Degree
In terms of associate's degree, the demographic groups most similar to Nicaraguans are Bahamian (41.5%, a difference of 0.090%), Immigrants from Jamaica (41.5%, a difference of 0.11%), Osage (41.5%, a difference of 0.12%), Marshallese (41.6%, a difference of 0.13%), and Malaysian (41.6%, a difference of 0.32%).
| Demographics | Rating | Rank | Associate's Degree |
| Cubans | 0.6 /100 | #254 | Tragic 41.9% |
| Immigrants | Guyana | 0.5 /100 | #255 | Tragic 41.8% |
| Immigrants | Congo | 0.5 /100 | #256 | Tragic 41.8% |
| Spanish Americans | 0.5 /100 | #257 | Tragic 41.8% |
| Japanese | 0.5 /100 | #258 | Tragic 41.7% |
| Malaysians | 0.4 /100 | #259 | Tragic 41.6% |
| Marshallese | 0.4 /100 | #260 | Tragic 41.6% |
| Nicaraguans | 0.4 /100 | #261 | Tragic 41.5% |
| Bahamians | 0.4 /100 | #262 | Tragic 41.5% |
| Immigrants | Jamaica | 0.3 /100 | #263 | Tragic 41.5% |
| Osage | 0.3 /100 | #264 | Tragic 41.5% |
| Africans | 0.2 /100 | #265 | Tragic 41.1% |
| Samoans | 0.2 /100 | #266 | Tragic 41.1% |
| Hawaiians | 0.2 /100 | #267 | Tragic 40.9% |
| Central American Indians | 0.2 /100 | #268 | Tragic 40.8% |
Demographics Similar to Luxembourgers by Associate's Degree
In terms of associate's degree, the demographic groups most similar to Luxembourgers are Immigrants from Chile (49.0%, a difference of 0.070%), Palestinian (49.0%, a difference of 0.070%), Arab (49.0%, a difference of 0.070%), British (48.9%, a difference of 0.070%), and Afghan (48.9%, a difference of 0.11%).
| Demographics | Rating | Rank | Associate's Degree |
| Jordanians | 96.6 /100 | #108 | Exceptional 49.2% |
| Immigrants | Morocco | 96.3 /100 | #109 | Exceptional 49.2% |
| Austrians | 95.8 /100 | #110 | Exceptional 49.1% |
| Immigrants | Venezuela | 95.8 /100 | #111 | Exceptional 49.1% |
| Immigrants | Chile | 95.3 /100 | #112 | Exceptional 49.0% |
| Palestinians | 95.3 /100 | #113 | Exceptional 49.0% |
| Arabs | 95.3 /100 | #114 | Exceptional 49.0% |
| Luxembourgers | 95.1 /100 | #115 | Exceptional 48.9% |
| British | 95.0 /100 | #116 | Exceptional 48.9% |
| Afghans | 94.8 /100 | #117 | Exceptional 48.9% |
| Albanians | 94.7 /100 | #118 | Exceptional 48.8% |
| Lebanese | 94.6 /100 | #119 | Exceptional 48.8% |
| Alsatians | 94.6 /100 | #120 | Exceptional 48.8% |
| Ugandans | 93.9 /100 | #121 | Exceptional 48.7% |
| Italians | 93.9 /100 | #122 | Exceptional 48.7% |