Dominican vs Immigrants from West Indies Kindergarten
COMPARE
Dominican
Immigrants from West Indies
Kindergarten
Kindergarten Comparison
Dominicans
Immigrants from West Indies
96.8%
KINDERGARTEN
0.0/ 100
METRIC RATING
326th/ 347
METRIC RANK
97.3%
KINDERGARTEN
0.0/ 100
METRIC RATING
283rd/ 347
METRIC RANK
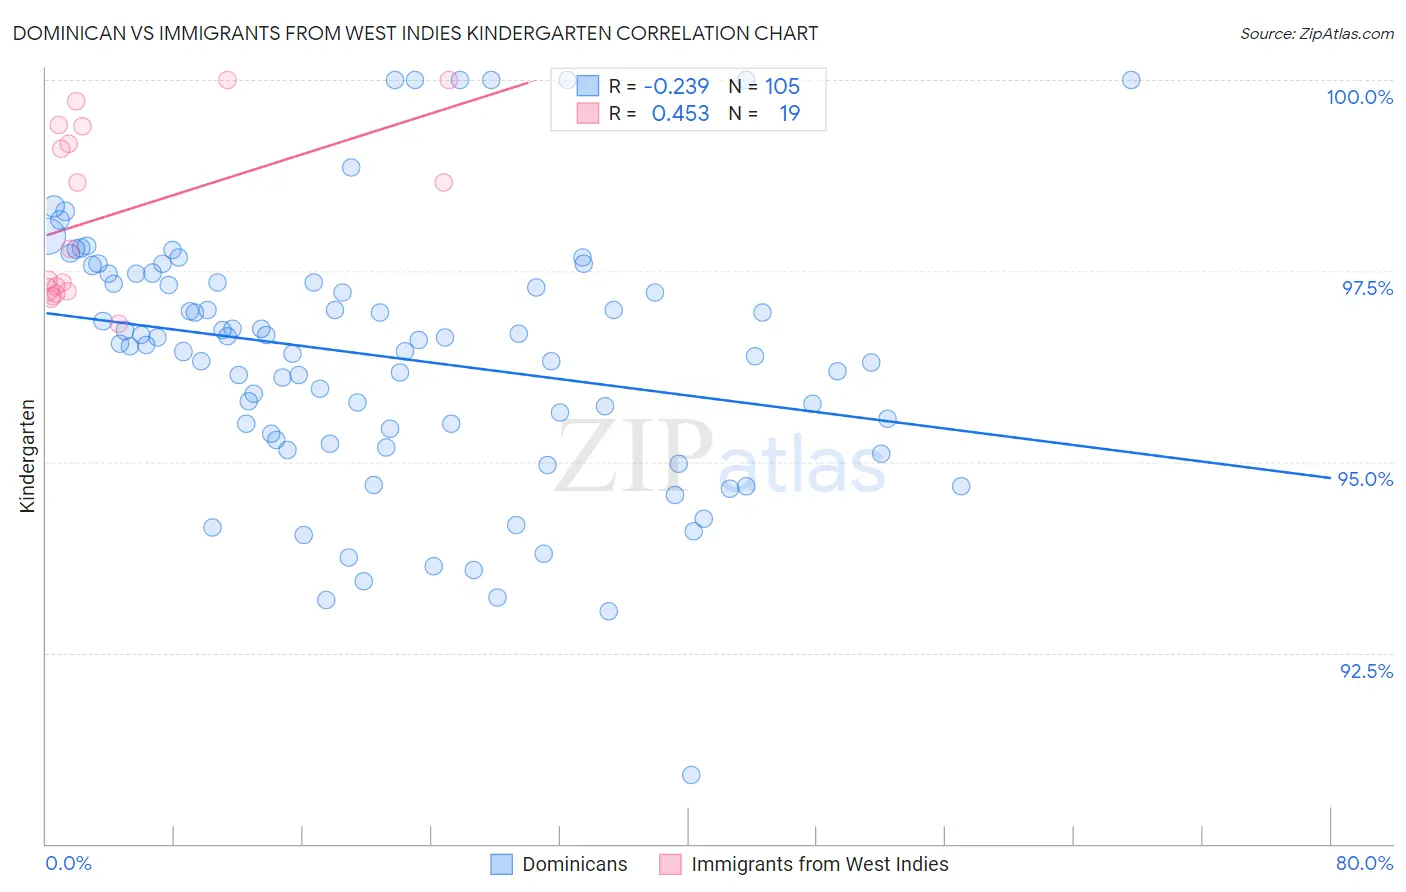
Dominican vs Immigrants from West Indies Kindergarten Correlation Chart
The statistical analysis conducted on geographies consisting of 355,142,603 people shows a weak negative correlation between the proportion of Dominicans and percentage of population with at least kindergarten education in the United States with a correlation coefficient (R) of -0.239 and weighted average of 96.8%. Similarly, the statistical analysis conducted on geographies consisting of 72,457,514 people shows a moderate positive correlation between the proportion of Immigrants from West Indies and percentage of population with at least kindergarten education in the United States with a correlation coefficient (R) of 0.453 and weighted average of 97.3%, a difference of 0.59%.
Kindergarten Correlation Summary
| Measurement | Dominican | Immigrants from West Indies |
| Minimum | 90.9% | 96.8% |
| Maximum | 100.0% | 100.0% |
| Range | 9.1% | 3.2% |
| Mean | 96.4% | 98.2% |
| Median | 96.6% | 97.8% |
| Interquartile 25% (IQ1) | 95.3% | 97.2% |
| Interquartile 75% (IQ3) | 97.4% | 99.4% |
| Interquartile Range (IQR) | 2.1% | 2.2% |
| Standard Deviation (Sample) | 1.7% | 1.1% |
| Standard Deviation (Population) | 1.7% | 1.1% |
Similar Demographics by Kindergarten
Demographics Similar to Dominicans by Kindergarten
In terms of kindergarten, the demographic groups most similar to Dominicans are Indonesian (96.8%, a difference of 0.010%), Vietnamese (96.8%, a difference of 0.030%), Immigrants from Honduras (96.8%, a difference of 0.040%), Immigrants from Bangladesh (96.8%, a difference of 0.060%), and Mexican American Indian (96.8%, a difference of 0.060%).
| Demographics | Rating | Rank | Kindergarten |
| Immigrants | Guyana | 0.0 /100 | #319 | Tragic 96.8% |
| Immigrants | Burma/Myanmar | 0.0 /100 | #320 | Tragic 96.8% |
| Immigrants | Bangladesh | 0.0 /100 | #321 | Tragic 96.8% |
| Mexican American Indians | 0.0 /100 | #322 | Tragic 96.8% |
| Immigrants | Honduras | 0.0 /100 | #323 | Tragic 96.8% |
| Vietnamese | 0.0 /100 | #324 | Tragic 96.8% |
| Indonesians | 0.0 /100 | #325 | Tragic 96.8% |
| Dominicans | 0.0 /100 | #326 | Tragic 96.8% |
| Mexicans | 0.0 /100 | #327 | Tragic 96.7% |
| Immigrants | Latin America | 0.0 /100 | #328 | Tragic 96.7% |
| Immigrants | Vietnam | 0.0 /100 | #329 | Tragic 96.7% |
| Japanese | 0.0 /100 | #330 | Tragic 96.7% |
| Immigrants | Armenia | 0.0 /100 | #331 | Tragic 96.6% |
| Yakama | 0.0 /100 | #332 | Tragic 96.6% |
| Central Americans | 0.0 /100 | #333 | Tragic 96.6% |
Demographics Similar to Immigrants from West Indies by Kindergarten
In terms of kindergarten, the demographic groups most similar to Immigrants from West Indies are Immigrants from Trinidad and Tobago (97.3%, a difference of 0.010%), Immigrants from Portugal (97.3%, a difference of 0.020%), Afghan (97.4%, a difference of 0.030%), Immigrants from Barbados (97.3%, a difference of 0.030%), and Immigrants from Hong Kong (97.3%, a difference of 0.030%).
| Demographics | Rating | Rank | Kindergarten |
| Immigrants | Philippines | 0.1 /100 | #276 | Tragic 97.4% |
| Immigrants | Western Africa | 0.1 /100 | #277 | Tragic 97.4% |
| Immigrants | Uzbekistan | 0.1 /100 | #278 | Tragic 97.4% |
| Immigrants | Ghana | 0.1 /100 | #279 | Tragic 97.4% |
| Barbadians | 0.1 /100 | #280 | Tragic 97.4% |
| Trinidadians and Tobagonians | 0.1 /100 | #281 | Tragic 97.4% |
| Afghans | 0.0 /100 | #282 | Tragic 97.4% |
| Immigrants | West Indies | 0.0 /100 | #283 | Tragic 97.3% |
| Immigrants | Trinidad and Tobago | 0.0 /100 | #284 | Tragic 97.3% |
| Immigrants | Portugal | 0.0 /100 | #285 | Tragic 97.3% |
| Immigrants | Barbados | 0.0 /100 | #286 | Tragic 97.3% |
| Immigrants | Hong Kong | 0.0 /100 | #287 | Tragic 97.3% |
| Immigrants | Thailand | 0.0 /100 | #288 | Tragic 97.3% |
| Immigrants | Afghanistan | 0.0 /100 | #289 | Tragic 97.3% |
| Immigrants | St. Vincent and the Grenadines | 0.0 /100 | #290 | Tragic 97.3% |