Dominican vs Immigrants from West Indies In Labor Force | Age 45-54
COMPARE
Dominican
Immigrants from West Indies
In Labor Force | Age 45-54
In Labor Force | Age 45-54 Comparison
Dominicans
Immigrants from West Indies
80.3%
IN LABOR FORCE | AGE 45-54
0.0/ 100
METRIC RATING
299th/ 347
METRIC RANK
81.5%
IN LABOR FORCE | AGE 45-54
0.1/ 100
METRIC RATING
264th/ 347
METRIC RANK
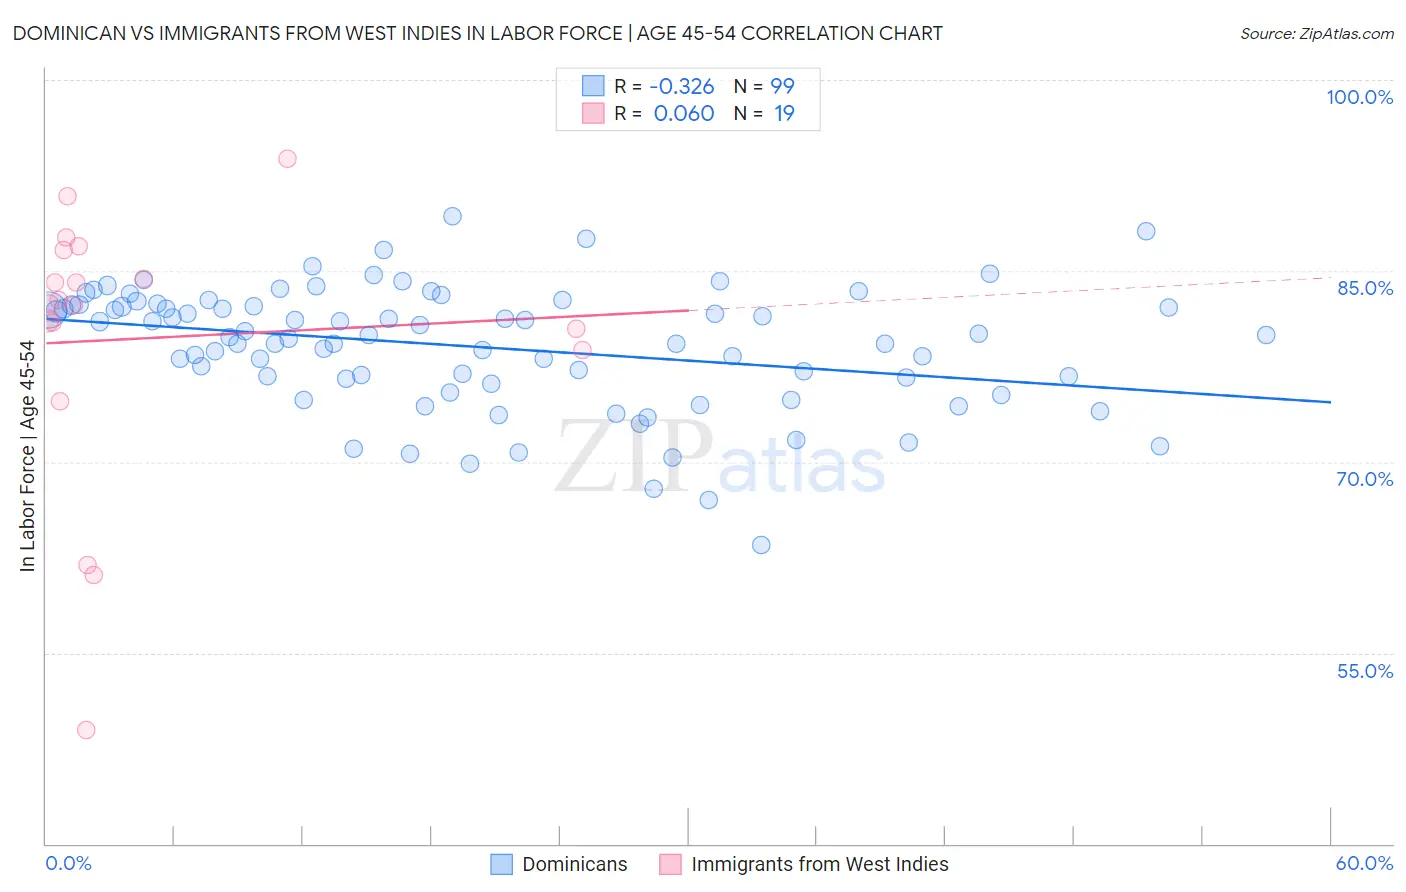
Dominican vs Immigrants from West Indies In Labor Force | Age 45-54 Correlation Chart
The statistical analysis conducted on geographies consisting of 354,749,305 people shows a mild negative correlation between the proportion of Dominicans and labor force participation rate among population between the ages 45 and 54 in the United States with a correlation coefficient (R) of -0.326 and weighted average of 80.3%. Similarly, the statistical analysis conducted on geographies consisting of 72,454,628 people shows a slight positive correlation between the proportion of Immigrants from West Indies and labor force participation rate among population between the ages 45 and 54 in the United States with a correlation coefficient (R) of 0.060 and weighted average of 81.5%, a difference of 1.5%.
In Labor Force | Age 45-54 Correlation Summary
| Measurement | Dominican | Immigrants from West Indies |
| Minimum | 63.5% | 48.9% |
| Maximum | 89.3% | 93.8% |
| Range | 25.8% | 44.9% |
| Mean | 79.0% | 79.7% |
| Median | 80.0% | 82.4% |
| Interquartile 25% (IQ1) | 76.6% | 78.8% |
| Interquartile 75% (IQ3) | 82.3% | 86.6% |
| Interquartile Range (IQR) | 5.8% | 7.8% |
| Standard Deviation (Sample) | 4.8% | 11.1% |
| Standard Deviation (Population) | 4.8% | 10.8% |
Similar Demographics by In Labor Force | Age 45-54
Demographics Similar to Dominicans by In Labor Force | Age 45-54
In terms of in labor force | age 45-54, the demographic groups most similar to Dominicans are Fijian (80.2%, a difference of 0.0%), Spanish American Indian (80.2%, a difference of 0.020%), Immigrants from Central America (80.2%, a difference of 0.10%), Marshallese (80.3%, a difference of 0.11%), and American (80.4%, a difference of 0.15%).
| Demographics | Rating | Rank | In Labor Force | Age 45-54 |
| Iroquois | 0.0 /100 | #292 | Tragic 80.6% |
| Osage | 0.0 /100 | #293 | Tragic 80.6% |
| Yakama | 0.0 /100 | #294 | Tragic 80.6% |
| Nepalese | 0.0 /100 | #295 | Tragic 80.5% |
| Africans | 0.0 /100 | #296 | Tragic 80.5% |
| Americans | 0.0 /100 | #297 | Tragic 80.4% |
| Marshallese | 0.0 /100 | #298 | Tragic 80.3% |
| Dominicans | 0.0 /100 | #299 | Tragic 80.3% |
| Fijians | 0.0 /100 | #300 | Tragic 80.2% |
| Spanish American Indians | 0.0 /100 | #301 | Tragic 80.2% |
| Immigrants | Central America | 0.0 /100 | #302 | Tragic 80.2% |
| Immigrants | Azores | 0.0 /100 | #303 | Tragic 80.1% |
| Hispanics or Latinos | 0.0 /100 | #304 | Tragic 80.1% |
| Immigrants | Dominican Republic | 0.0 /100 | #305 | Tragic 80.1% |
| Spanish Americans | 0.0 /100 | #306 | Tragic 80.1% |
Demographics Similar to Immigrants from West Indies by In Labor Force | Age 45-54
In terms of in labor force | age 45-54, the demographic groups most similar to Immigrants from West Indies are Indonesian (81.5%, a difference of 0.010%), Hawaiian (81.5%, a difference of 0.020%), Immigrants from Guyana (81.5%, a difference of 0.020%), Spaniard (81.5%, a difference of 0.030%), and Honduran (81.4%, a difference of 0.050%).
| Demographics | Rating | Rank | In Labor Force | Age 45-54 |
| Immigrants | Congo | 0.1 /100 | #257 | Tragic 81.6% |
| Immigrants | Fiji | 0.1 /100 | #258 | Tragic 81.5% |
| Guyanese | 0.1 /100 | #259 | Tragic 81.5% |
| Spaniards | 0.1 /100 | #260 | Tragic 81.5% |
| Hawaiians | 0.1 /100 | #261 | Tragic 81.5% |
| Immigrants | Guyana | 0.1 /100 | #262 | Tragic 81.5% |
| Indonesians | 0.1 /100 | #263 | Tragic 81.5% |
| Immigrants | West Indies | 0.1 /100 | #264 | Tragic 81.5% |
| Hondurans | 0.1 /100 | #265 | Tragic 81.4% |
| Immigrants | St. Vincent and the Grenadines | 0.1 /100 | #266 | Tragic 81.4% |
| West Indians | 0.1 /100 | #267 | Tragic 81.4% |
| Immigrants | Honduras | 0.0 /100 | #268 | Tragic 81.4% |
| Alsatians | 0.0 /100 | #269 | Tragic 81.3% |
| Bangladeshis | 0.0 /100 | #270 | Tragic 81.3% |
| Immigrants | Barbados | 0.0 /100 | #271 | Tragic 81.3% |