Dominican vs German Doctorate Degree
COMPARE
Dominican
German
Doctorate Degree
Doctorate Degree Comparison
Dominicans
Germans
1.4%
DOCTORATE DEGREE
0.1/ 100
METRIC RATING
314th/ 347
METRIC RANK
1.8%
DOCTORATE DEGREE
30.5/ 100
METRIC RATING
188th/ 347
METRIC RANK
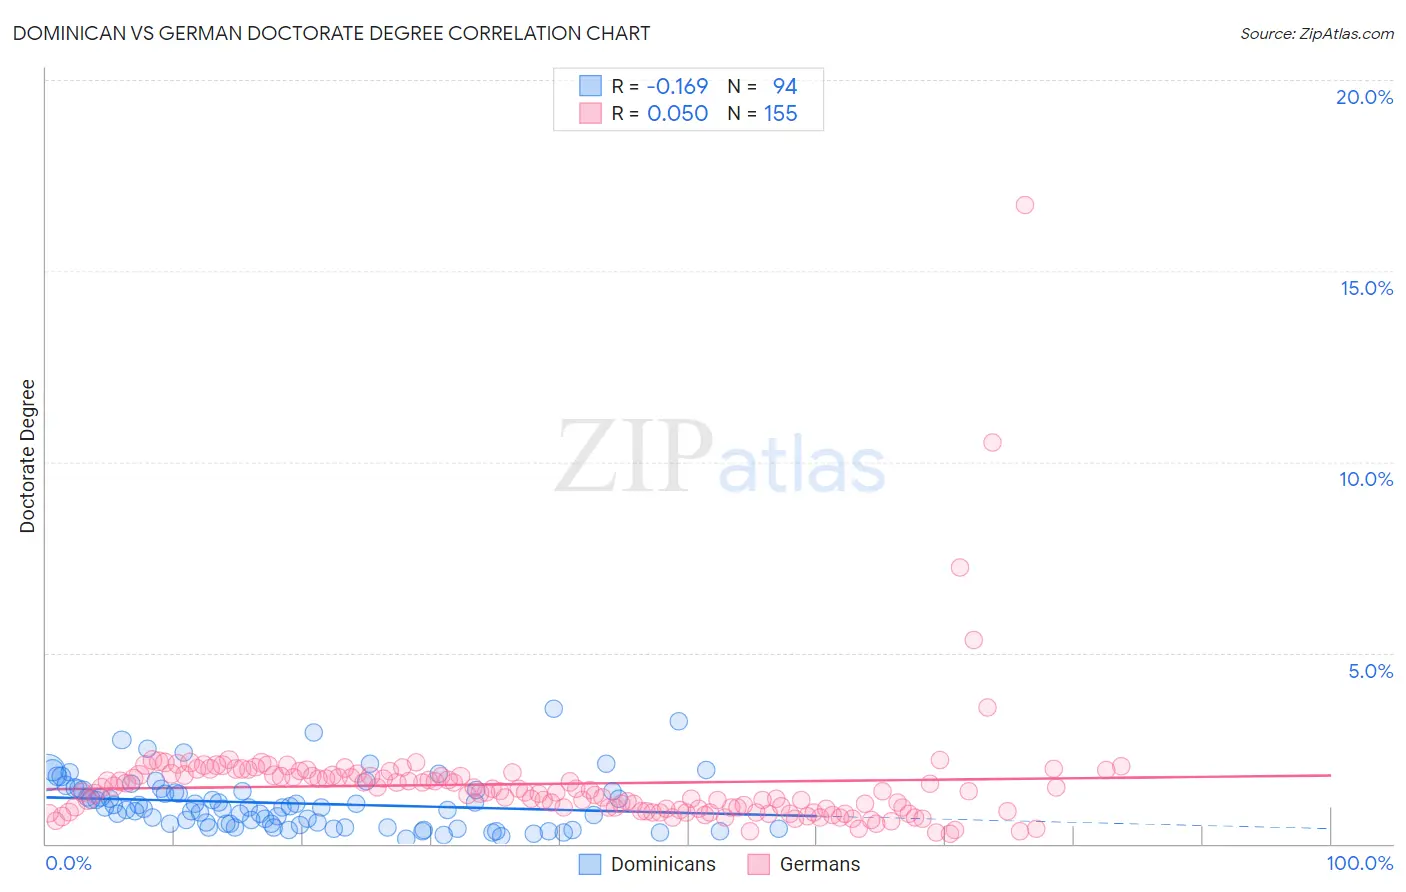
Dominican vs German Doctorate Degree Correlation Chart
The statistical analysis conducted on geographies consisting of 351,566,637 people shows a poor negative correlation between the proportion of Dominicans and percentage of population with at least doctorate degree education in the United States with a correlation coefficient (R) of -0.169 and weighted average of 1.4%. Similarly, the statistical analysis conducted on geographies consisting of 551,426,509 people shows no correlation between the proportion of Germans and percentage of population with at least doctorate degree education in the United States with a correlation coefficient (R) of 0.050 and weighted average of 1.8%, a difference of 31.7%.
Doctorate Degree Correlation Summary
| Measurement | Dominican | German |
| Minimum | 0.14% | 0.25% |
| Maximum | 3.5% | 16.7% |
| Range | 3.4% | 16.5% |
| Mean | 1.1% | 1.6% |
| Median | 0.94% | 1.4% |
| Interquartile 25% (IQ1) | 0.51% | 0.89% |
| Interquartile 75% (IQ3) | 1.4% | 1.8% |
| Interquartile Range (IQR) | 0.88% | 0.92% |
| Standard Deviation (Sample) | 0.69% | 1.6% |
| Standard Deviation (Population) | 0.69% | 1.6% |
Similar Demographics by Doctorate Degree
Demographics Similar to Dominicans by Doctorate Degree
In terms of doctorate degree, the demographic groups most similar to Dominicans are Immigrants from the Azores (1.4%, a difference of 0.020%), Menominee (1.4%, a difference of 0.080%), Navajo (1.4%, a difference of 0.23%), Immigrants from Nicaragua (1.4%, a difference of 0.39%), and Immigrants from Micronesia (1.3%, a difference of 0.48%).
| Demographics | Rating | Rank | Doctorate Degree |
| Cubans | 0.1 /100 | #307 | Tragic 1.4% |
| Immigrants | Laos | 0.1 /100 | #308 | Tragic 1.4% |
| Immigrants | Grenada | 0.1 /100 | #309 | Tragic 1.4% |
| Immigrants | Jamaica | 0.1 /100 | #310 | Tragic 1.4% |
| Immigrants | Honduras | 0.1 /100 | #311 | Tragic 1.4% |
| Immigrants | Nicaragua | 0.1 /100 | #312 | Tragic 1.4% |
| Menominee | 0.1 /100 | #313 | Tragic 1.4% |
| Dominicans | 0.1 /100 | #314 | Tragic 1.4% |
| Immigrants | Azores | 0.1 /100 | #315 | Tragic 1.4% |
| Navajo | 0.1 /100 | #316 | Tragic 1.4% |
| Immigrants | Micronesia | 0.1 /100 | #317 | Tragic 1.3% |
| Creek | 0.1 /100 | #318 | Tragic 1.3% |
| Immigrants | Guyana | 0.1 /100 | #319 | Tragic 1.3% |
| Immigrants | St. Vincent and the Grenadines | 0.1 /100 | #320 | Tragic 1.3% |
| Dutch West Indians | 0.1 /100 | #321 | Tragic 1.3% |
Demographics Similar to Germans by Doctorate Degree
In terms of doctorate degree, the demographic groups most similar to Germans are French Canadian (1.8%, a difference of 0.040%), Immigrants from Costa Rica (1.8%, a difference of 0.060%), South American (1.8%, a difference of 0.18%), Czechoslovakian (1.8%, a difference of 0.45%), and Dutch (1.8%, a difference of 0.57%).
| Demographics | Rating | Rank | Doctorate Degree |
| Immigrants | Immigrants | 46.2 /100 | #181 | Average 1.8% |
| Immigrants | Afghanistan | 44.3 /100 | #182 | Average 1.8% |
| Finns | 42.1 /100 | #183 | Average 1.8% |
| Nigerians | 39.9 /100 | #184 | Fair 1.8% |
| Slovaks | 36.4 /100 | #185 | Fair 1.8% |
| Peruvians | 34.4 /100 | #186 | Fair 1.8% |
| Czechoslovakians | 33.0 /100 | #187 | Fair 1.8% |
| Germans | 30.5 /100 | #188 | Fair 1.8% |
| French Canadians | 30.2 /100 | #189 | Fair 1.8% |
| Immigrants | Costa Rica | 30.2 /100 | #190 | Fair 1.8% |
| South Americans | 29.5 /100 | #191 | Fair 1.8% |
| Dutch | 27.4 /100 | #192 | Fair 1.8% |
| German Russians | 27.1 /100 | #193 | Fair 1.8% |
| Uruguayans | 26.2 /100 | #194 | Fair 1.8% |
| Immigrants | Somalia | 25.4 /100 | #195 | Fair 1.8% |