Yugoslavian vs Immigrants from Scotland 8th Grade
COMPARE
Yugoslavian
Immigrants from Scotland
8th Grade
8th Grade Comparison
Yugoslavians
Immigrants from Scotland
96.5%
8TH GRADE
99.4/ 100
METRIC RATING
78th/ 347
METRIC RANK
96.8%
8TH GRADE
99.9/ 100
METRIC RATING
50th/ 347
METRIC RANK
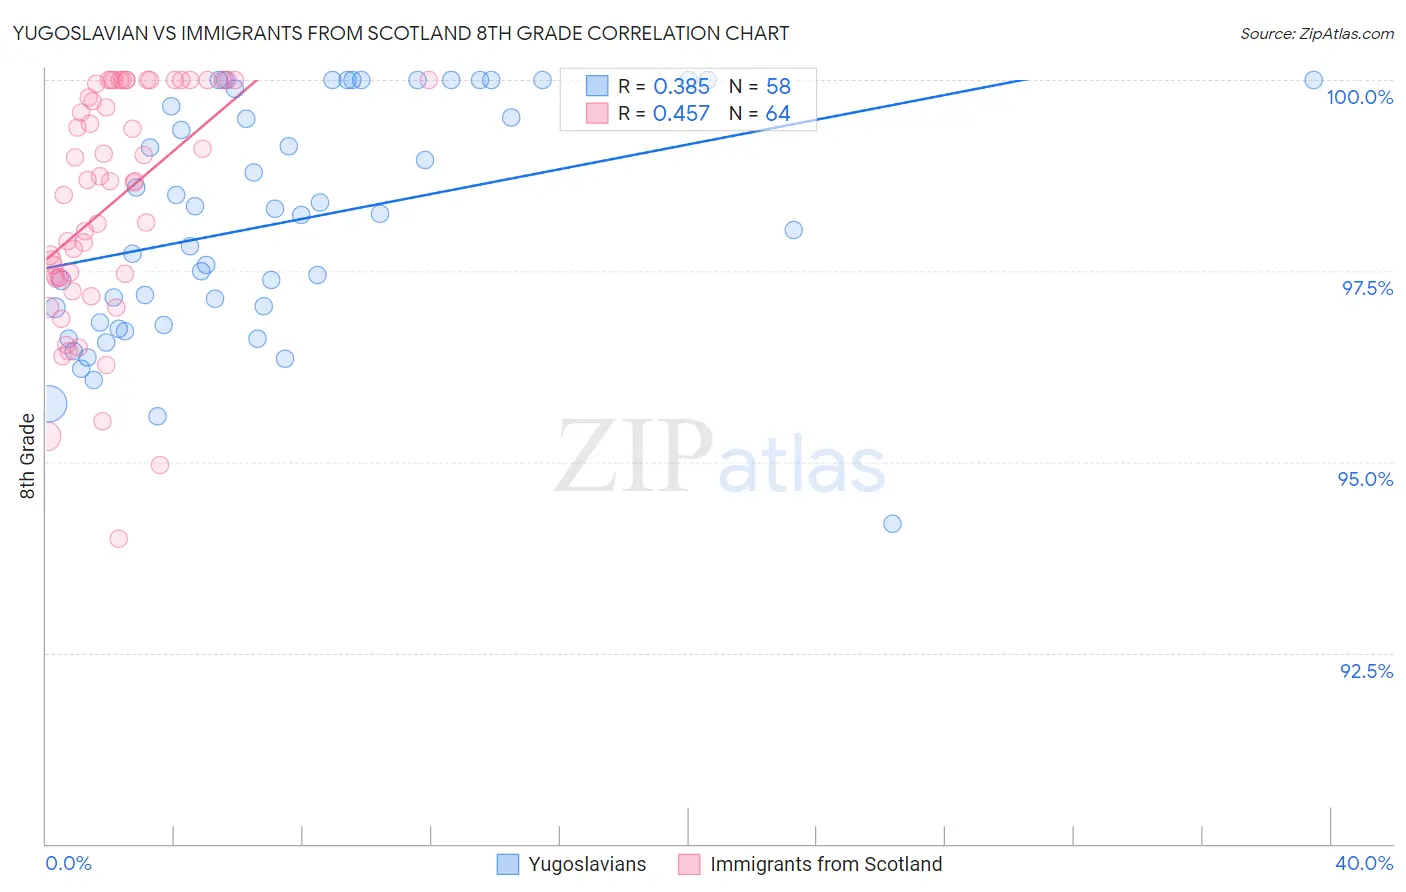
Yugoslavian vs Immigrants from Scotland 8th Grade Correlation Chart
The statistical analysis conducted on geographies consisting of 285,618,157 people shows a mild positive correlation between the proportion of Yugoslavians and percentage of population with at least 8th grade education in the United States with a correlation coefficient (R) of 0.385 and weighted average of 96.5%. Similarly, the statistical analysis conducted on geographies consisting of 196,398,887 people shows a moderate positive correlation between the proportion of Immigrants from Scotland and percentage of population with at least 8th grade education in the United States with a correlation coefficient (R) of 0.457 and weighted average of 96.8%, a difference of 0.29%.
8th Grade Correlation Summary
| Measurement | Yugoslavian | Immigrants from Scotland |
| Minimum | 94.2% | 94.0% |
| Maximum | 100.0% | 100.0% |
| Range | 5.8% | 6.0% |
| Mean | 98.2% | 98.4% |
| Median | 98.2% | 98.7% |
| Interquartile 25% (IQ1) | 96.8% | 97.4% |
| Interquartile 75% (IQ3) | 99.9% | 100.0% |
| Interquartile Range (IQR) | 3.1% | 2.6% |
| Standard Deviation (Sample) | 1.5% | 1.5% |
| Standard Deviation (Population) | 1.5% | 1.5% |
Similar Demographics by 8th Grade
Demographics Similar to Yugoslavians by 8th Grade
In terms of 8th grade, the demographic groups most similar to Yugoslavians are Cypriot (96.5%, a difference of 0.0%), Zimbabwean (96.5%, a difference of 0.010%), Immigrants from Netherlands (96.5%, a difference of 0.010%), Immigrants from Ireland (96.5%, a difference of 0.020%), and Puget Sound Salish (96.5%, a difference of 0.020%).
| Demographics | Rating | Rank | 8th Grade |
| New Zealanders | 99.5 /100 | #71 | Exceptional 96.6% |
| Immigrants | England | 99.5 /100 | #72 | Exceptional 96.6% |
| Arapaho | 99.5 /100 | #73 | Exceptional 96.6% |
| Immigrants | Ireland | 99.5 /100 | #74 | Exceptional 96.5% |
| Zimbabweans | 99.4 /100 | #75 | Exceptional 96.5% |
| Immigrants | Netherlands | 99.4 /100 | #76 | Exceptional 96.5% |
| Cypriots | 99.4 /100 | #77 | Exceptional 96.5% |
| Yugoslavians | 99.4 /100 | #78 | Exceptional 96.5% |
| Puget Sound Salish | 99.3 /100 | #79 | Exceptional 96.5% |
| Delaware | 99.2 /100 | #80 | Exceptional 96.5% |
| Romanians | 99.2 /100 | #81 | Exceptional 96.5% |
| Turks | 99.2 /100 | #82 | Exceptional 96.5% |
| Icelanders | 99.2 /100 | #83 | Exceptional 96.5% |
| Immigrants | Belgium | 99.1 /100 | #84 | Exceptional 96.5% |
| Immigrants | South Africa | 99.1 /100 | #85 | Exceptional 96.5% |
Demographics Similar to Immigrants from Scotland by 8th Grade
In terms of 8th grade, the demographic groups most similar to Immigrants from Scotland are Estonian (96.8%, a difference of 0.010%), Celtic (96.8%, a difference of 0.010%), Slavic (96.8%, a difference of 0.020%), Greek (96.8%, a difference of 0.040%), and Bulgarian (96.9%, a difference of 0.050%).
| Demographics | Rating | Rank | 8th Grade |
| Aleuts | 99.9 /100 | #43 | Exceptional 96.9% |
| Maltese | 99.9 /100 | #44 | Exceptional 96.9% |
| Northern Europeans | 99.9 /100 | #45 | Exceptional 96.9% |
| Czechoslovakians | 99.9 /100 | #46 | Exceptional 96.9% |
| Bulgarians | 99.9 /100 | #47 | Exceptional 96.9% |
| Slavs | 99.9 /100 | #48 | Exceptional 96.8% |
| Estonians | 99.9 /100 | #49 | Exceptional 96.8% |
| Immigrants | Scotland | 99.9 /100 | #50 | Exceptional 96.8% |
| Celtics | 99.9 /100 | #51 | Exceptional 96.8% |
| Greeks | 99.9 /100 | #52 | Exceptional 96.8% |
| Austrians | 99.9 /100 | #53 | Exceptional 96.7% |
| Serbians | 99.8 /100 | #54 | Exceptional 96.7% |
| Russians | 99.8 /100 | #55 | Exceptional 96.7% |
| Australians | 99.8 /100 | #56 | Exceptional 96.7% |
| Macedonians | 99.8 /100 | #57 | Exceptional 96.7% |