Immigrants from Barbados vs Immigrants from Scotland 8th Grade
COMPARE
Immigrants from Barbados
Immigrants from Scotland
8th Grade
8th Grade Comparison
Immigrants from Barbados
Immigrants from Scotland
94.5%
8TH GRADE
0.0/ 100
METRIC RATING
285th/ 347
METRIC RANK
96.8%
8TH GRADE
99.9/ 100
METRIC RATING
50th/ 347
METRIC RANK
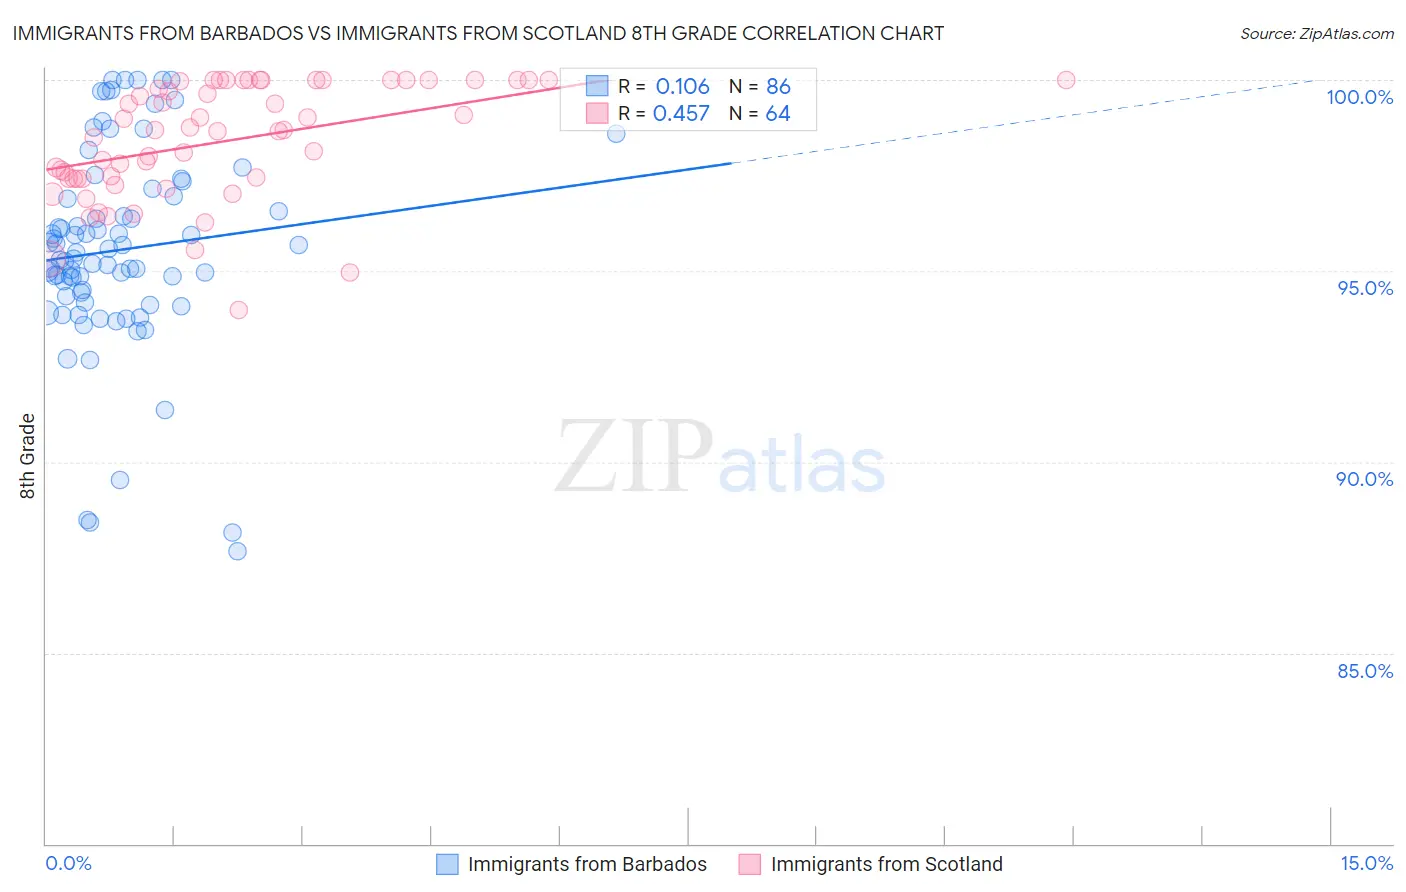
Immigrants from Barbados vs Immigrants from Scotland 8th Grade Correlation Chart
The statistical analysis conducted on geographies consisting of 112,787,165 people shows a poor positive correlation between the proportion of Immigrants from Barbados and percentage of population with at least 8th grade education in the United States with a correlation coefficient (R) of 0.106 and weighted average of 94.5%. Similarly, the statistical analysis conducted on geographies consisting of 196,398,887 people shows a moderate positive correlation between the proportion of Immigrants from Scotland and percentage of population with at least 8th grade education in the United States with a correlation coefficient (R) of 0.457 and weighted average of 96.8%, a difference of 2.4%.
8th Grade Correlation Summary
| Measurement | Immigrants from Barbados | Immigrants from Scotland |
| Minimum | 87.6% | 94.0% |
| Maximum | 100.0% | 100.0% |
| Range | 12.4% | 6.0% |
| Mean | 95.6% | 98.4% |
| Median | 95.4% | 98.7% |
| Interquartile 25% (IQ1) | 94.3% | 97.4% |
| Interquartile 75% (IQ3) | 96.9% | 100.0% |
| Interquartile Range (IQR) | 2.6% | 2.6% |
| Standard Deviation (Sample) | 2.7% | 1.5% |
| Standard Deviation (Population) | 2.7% | 1.5% |
Similar Demographics by 8th Grade
Demographics Similar to Immigrants from Barbados by 8th Grade
In terms of 8th grade, the demographic groups most similar to Immigrants from Barbados are Immigrants from Philippines (94.6%, a difference of 0.030%), Immigrants from St. Vincent and the Grenadines (94.6%, a difference of 0.040%), Immigrants from Peru (94.5%, a difference of 0.050%), Tohono O'odham (94.5%, a difference of 0.060%), and Immigrants from Eritrea (94.6%, a difference of 0.070%).
| Demographics | Rating | Rank | 8th Grade |
| Armenians | 0.1 /100 | #278 | Tragic 94.7% |
| Immigrants | Trinidad and Tobago | 0.1 /100 | #279 | Tragic 94.6% |
| Barbadians | 0.1 /100 | #280 | Tragic 94.6% |
| Immigrants | Bolivia | 0.1 /100 | #281 | Tragic 94.6% |
| Immigrants | Eritrea | 0.1 /100 | #282 | Tragic 94.6% |
| Immigrants | St. Vincent and the Grenadines | 0.1 /100 | #283 | Tragic 94.6% |
| Immigrants | Philippines | 0.1 /100 | #284 | Tragic 94.6% |
| Immigrants | Barbados | 0.0 /100 | #285 | Tragic 94.5% |
| Immigrants | Peru | 0.0 /100 | #286 | Tragic 94.5% |
| Tohono O'odham | 0.0 /100 | #287 | Tragic 94.5% |
| Malaysians | 0.0 /100 | #288 | Tragic 94.5% |
| British West Indians | 0.0 /100 | #289 | Tragic 94.4% |
| Immigrants | West Indies | 0.0 /100 | #290 | Tragic 94.3% |
| Immigrants | Grenada | 0.0 /100 | #291 | Tragic 94.3% |
| Bangladeshis | 0.0 /100 | #292 | Tragic 94.3% |
Demographics Similar to Immigrants from Scotland by 8th Grade
In terms of 8th grade, the demographic groups most similar to Immigrants from Scotland are Estonian (96.8%, a difference of 0.010%), Celtic (96.8%, a difference of 0.010%), Slavic (96.8%, a difference of 0.020%), Greek (96.8%, a difference of 0.040%), and Bulgarian (96.9%, a difference of 0.050%).
| Demographics | Rating | Rank | 8th Grade |
| Aleuts | 99.9 /100 | #43 | Exceptional 96.9% |
| Maltese | 99.9 /100 | #44 | Exceptional 96.9% |
| Northern Europeans | 99.9 /100 | #45 | Exceptional 96.9% |
| Czechoslovakians | 99.9 /100 | #46 | Exceptional 96.9% |
| Bulgarians | 99.9 /100 | #47 | Exceptional 96.9% |
| Slavs | 99.9 /100 | #48 | Exceptional 96.8% |
| Estonians | 99.9 /100 | #49 | Exceptional 96.8% |
| Immigrants | Scotland | 99.9 /100 | #50 | Exceptional 96.8% |
| Celtics | 99.9 /100 | #51 | Exceptional 96.8% |
| Greeks | 99.9 /100 | #52 | Exceptional 96.8% |
| Austrians | 99.9 /100 | #53 | Exceptional 96.7% |
| Serbians | 99.8 /100 | #54 | Exceptional 96.7% |
| Russians | 99.8 /100 | #55 | Exceptional 96.7% |
| Australians | 99.8 /100 | #56 | Exceptional 96.7% |
| Macedonians | 99.8 /100 | #57 | Exceptional 96.7% |