Dominican vs Immigrants from Jamaica 8th Grade
COMPARE
Dominican
Immigrants from Jamaica
8th Grade
8th Grade Comparison
Dominicans
Immigrants from Jamaica
92.8%
8TH GRADE
0.0/ 100
METRIC RATING
325th/ 347
METRIC RANK
94.9%
8TH GRADE
0.6/ 100
METRIC RATING
260th/ 347
METRIC RANK
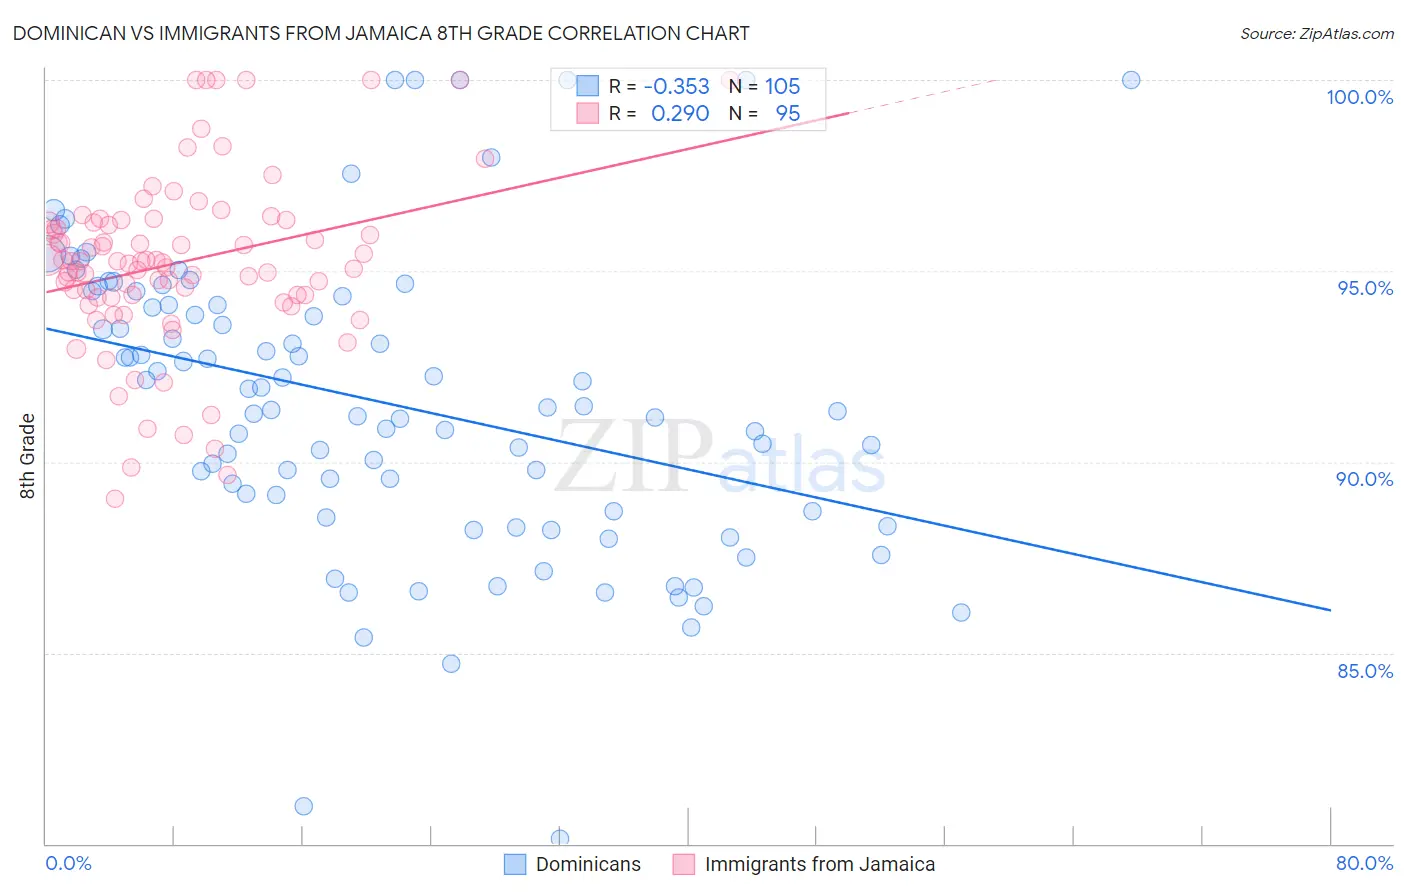
Dominican vs Immigrants from Jamaica 8th Grade Correlation Chart
The statistical analysis conducted on geographies consisting of 355,142,603 people shows a mild negative correlation between the proportion of Dominicans and percentage of population with at least 8th grade education in the United States with a correlation coefficient (R) of -0.353 and weighted average of 92.8%. Similarly, the statistical analysis conducted on geographies consisting of 301,829,550 people shows a weak positive correlation between the proportion of Immigrants from Jamaica and percentage of population with at least 8th grade education in the United States with a correlation coefficient (R) of 0.290 and weighted average of 94.9%, a difference of 2.3%.
8th Grade Correlation Summary
| Measurement | Dominican | Immigrants from Jamaica |
| Minimum | 80.1% | 89.0% |
| Maximum | 100.0% | 100.0% |
| Range | 19.9% | 11.0% |
| Mean | 91.6% | 95.2% |
| Median | 91.4% | 95.2% |
| Interquartile 25% (IQ1) | 88.7% | 94.3% |
| Interquartile 75% (IQ3) | 94.2% | 96.3% |
| Interquartile Range (IQR) | 5.5% | 2.0% |
| Standard Deviation (Sample) | 3.9% | 2.3% |
| Standard Deviation (Population) | 3.9% | 2.3% |
Similar Demographics by 8th Grade
Demographics Similar to Dominicans by 8th Grade
In terms of 8th grade, the demographic groups most similar to Dominicans are Central American Indian (92.7%, a difference of 0.050%), Nepalese (92.8%, a difference of 0.090%), Immigrants from Belize (92.9%, a difference of 0.16%), Nicaraguan (93.0%, a difference of 0.22%), and Immigrants from the Azores (92.5%, a difference of 0.30%).
| Demographics | Rating | Rank | 8th Grade |
| Puerto Ricans | 0.0 /100 | #318 | Tragic 93.2% |
| Immigrants | Cuba | 0.0 /100 | #319 | Tragic 93.2% |
| Immigrants | Fiji | 0.0 /100 | #320 | Tragic 93.2% |
| Belizeans | 0.0 /100 | #321 | Tragic 93.1% |
| Nicaraguans | 0.0 /100 | #322 | Tragic 93.0% |
| Immigrants | Belize | 0.0 /100 | #323 | Tragic 92.9% |
| Nepalese | 0.0 /100 | #324 | Tragic 92.8% |
| Dominicans | 0.0 /100 | #325 | Tragic 92.8% |
| Central American Indians | 0.0 /100 | #326 | Tragic 92.7% |
| Immigrants | Azores | 0.0 /100 | #327 | Tragic 92.5% |
| Immigrants | Nicaragua | 0.0 /100 | #328 | Tragic 92.5% |
| Immigrants | Cabo Verde | 0.0 /100 | #329 | Tragic 92.4% |
| Immigrants | Armenia | 0.0 /100 | #330 | Tragic 92.3% |
| Hondurans | 0.0 /100 | #331 | Tragic 92.3% |
| Immigrants | Dominican Republic | 0.0 /100 | #332 | Tragic 92.3% |
Demographics Similar to Immigrants from Jamaica by 8th Grade
In terms of 8th grade, the demographic groups most similar to Immigrants from Jamaica are Ghanaian (94.9%, a difference of 0.0%), Immigrants from Congo (94.9%, a difference of 0.010%), Afghan (94.9%, a difference of 0.020%), Colombian (95.0%, a difference of 0.030%), and Immigrants from Somalia (95.0%, a difference of 0.040%).
| Demographics | Rating | Rank | 8th Grade |
| U.S. Virgin Islanders | 0.9 /100 | #253 | Tragic 95.0% |
| Immigrants | Cameroon | 0.8 /100 | #254 | Tragic 95.0% |
| Immigrants | Somalia | 0.7 /100 | #255 | Tragic 95.0% |
| Colombians | 0.7 /100 | #256 | Tragic 95.0% |
| Afghans | 0.6 /100 | #257 | Tragic 94.9% |
| Immigrants | Congo | 0.6 /100 | #258 | Tragic 94.9% |
| Ghanaians | 0.6 /100 | #259 | Tragic 94.9% |
| Immigrants | Jamaica | 0.6 /100 | #260 | Tragic 94.9% |
| Immigrants | Costa Rica | 0.5 /100 | #261 | Tragic 94.9% |
| Immigrants | Nigeria | 0.4 /100 | #262 | Tragic 94.9% |
| Immigrants | Hong Kong | 0.4 /100 | #263 | Tragic 94.9% |
| South Americans | 0.4 /100 | #264 | Tragic 94.9% |
| Yuman | 0.4 /100 | #265 | Tragic 94.9% |
| West Indians | 0.3 /100 | #266 | Tragic 94.8% |
| Immigrants | Ghana | 0.3 /100 | #267 | Tragic 94.8% |