Dominican vs Cajun 8th Grade
COMPARE
Dominican
Cajun
8th Grade
8th Grade Comparison
Dominicans
Cajuns
92.8%
8TH GRADE
0.0/ 100
METRIC RATING
325th/ 347
METRIC RANK
96.3%
8TH GRADE
97.1/ 100
METRIC RATING
110th/ 347
METRIC RANK
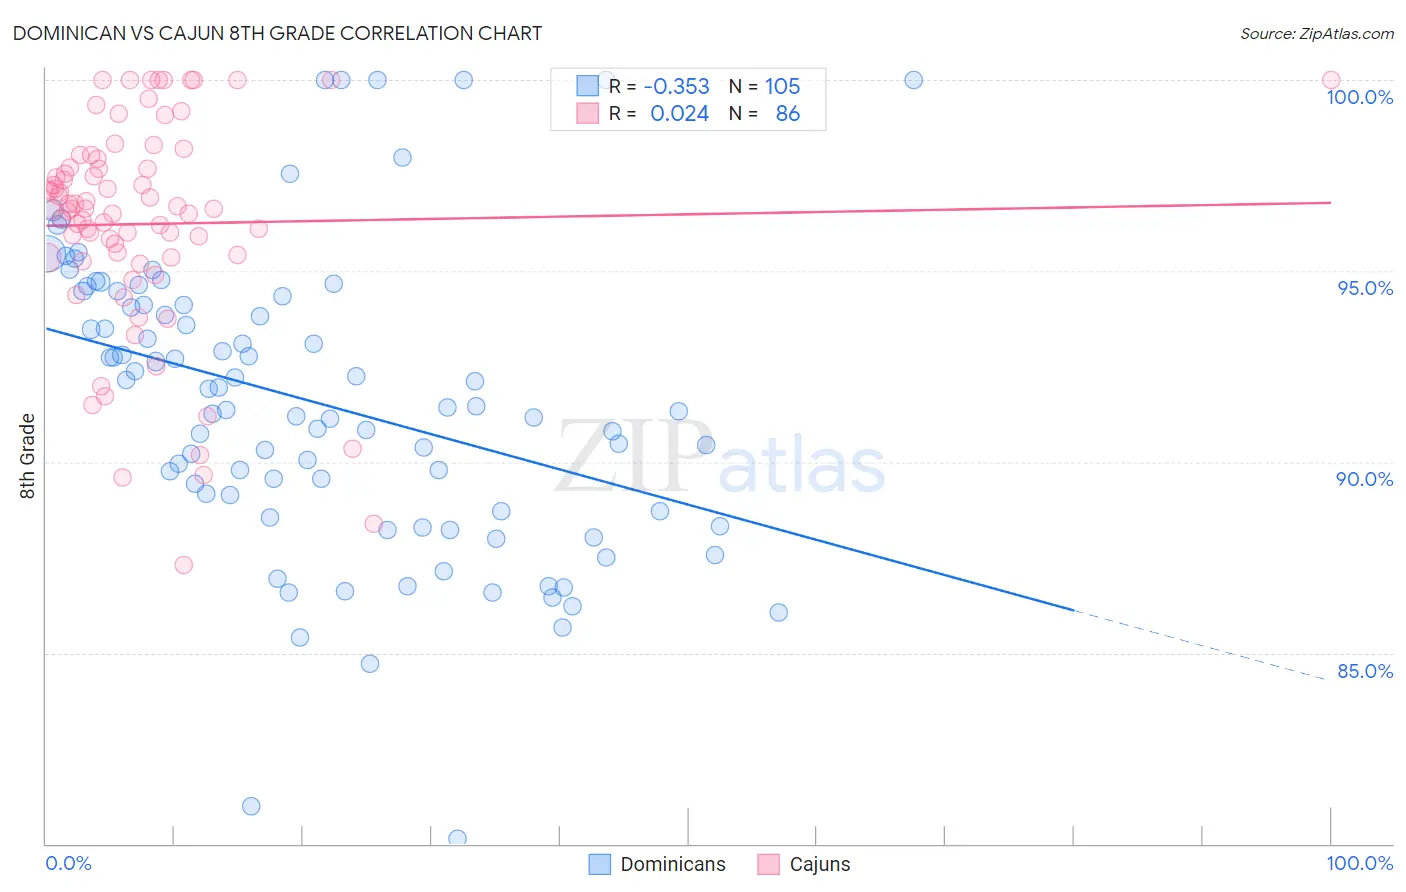
Dominican vs Cajun 8th Grade Correlation Chart
The statistical analysis conducted on geographies consisting of 355,142,603 people shows a mild negative correlation between the proportion of Dominicans and percentage of population with at least 8th grade education in the United States with a correlation coefficient (R) of -0.353 and weighted average of 92.8%. Similarly, the statistical analysis conducted on geographies consisting of 149,712,957 people shows no correlation between the proportion of Cajuns and percentage of population with at least 8th grade education in the United States with a correlation coefficient (R) of 0.024 and weighted average of 96.3%, a difference of 3.8%.
8th Grade Correlation Summary
| Measurement | Dominican | Cajun |
| Minimum | 80.1% | 87.3% |
| Maximum | 100.0% | 100.0% |
| Range | 19.9% | 12.7% |
| Mean | 91.6% | 96.2% |
| Median | 91.4% | 96.6% |
| Interquartile 25% (IQ1) | 88.7% | 95.4% |
| Interquartile 75% (IQ3) | 94.2% | 97.7% |
| Interquartile Range (IQR) | 5.5% | 2.4% |
| Standard Deviation (Sample) | 3.9% | 2.8% |
| Standard Deviation (Population) | 3.9% | 2.8% |
Similar Demographics by 8th Grade
Demographics Similar to Dominicans by 8th Grade
In terms of 8th grade, the demographic groups most similar to Dominicans are Central American Indian (92.7%, a difference of 0.050%), Nepalese (92.8%, a difference of 0.090%), Immigrants from Belize (92.9%, a difference of 0.16%), Nicaraguan (93.0%, a difference of 0.22%), and Immigrants from the Azores (92.5%, a difference of 0.30%).
| Demographics | Rating | Rank | 8th Grade |
| Puerto Ricans | 0.0 /100 | #318 | Tragic 93.2% |
| Immigrants | Cuba | 0.0 /100 | #319 | Tragic 93.2% |
| Immigrants | Fiji | 0.0 /100 | #320 | Tragic 93.2% |
| Belizeans | 0.0 /100 | #321 | Tragic 93.1% |
| Nicaraguans | 0.0 /100 | #322 | Tragic 93.0% |
| Immigrants | Belize | 0.0 /100 | #323 | Tragic 92.9% |
| Nepalese | 0.0 /100 | #324 | Tragic 92.8% |
| Dominicans | 0.0 /100 | #325 | Tragic 92.8% |
| Central American Indians | 0.0 /100 | #326 | Tragic 92.7% |
| Immigrants | Azores | 0.0 /100 | #327 | Tragic 92.5% |
| Immigrants | Nicaragua | 0.0 /100 | #328 | Tragic 92.5% |
| Immigrants | Cabo Verde | 0.0 /100 | #329 | Tragic 92.4% |
| Immigrants | Armenia | 0.0 /100 | #330 | Tragic 92.3% |
| Hondurans | 0.0 /100 | #331 | Tragic 92.3% |
| Immigrants | Dominican Republic | 0.0 /100 | #332 | Tragic 92.3% |
Demographics Similar to Cajuns by 8th Grade
In terms of 8th grade, the demographic groups most similar to Cajuns are Iroquois (96.3%, a difference of 0.020%), Shoshone (96.3%, a difference of 0.020%), Syrian (96.3%, a difference of 0.020%), Lebanese (96.3%, a difference of 0.030%), and Immigrants from Zimbabwe (96.3%, a difference of 0.030%).
| Demographics | Rating | Rank | 8th Grade |
| Immigrants | Saudi Arabia | 98.0 /100 | #103 | Exceptional 96.3% |
| Kiowa | 98.0 /100 | #104 | Exceptional 96.3% |
| Immigrants | North Macedonia | 98.0 /100 | #105 | Exceptional 96.3% |
| Okinawans | 98.0 /100 | #106 | Exceptional 96.3% |
| Immigrants | Latvia | 97.8 /100 | #107 | Exceptional 96.3% |
| Lebanese | 97.5 /100 | #108 | Exceptional 96.3% |
| Iroquois | 97.5 /100 | #109 | Exceptional 96.3% |
| Cajuns | 97.1 /100 | #110 | Exceptional 96.3% |
| Shoshone | 96.8 /100 | #111 | Exceptional 96.3% |
| Syrians | 96.7 /100 | #112 | Exceptional 96.3% |
| Immigrants | Zimbabwe | 96.7 /100 | #113 | Exceptional 96.3% |
| Immigrants | Japan | 96.5 /100 | #114 | Exceptional 96.2% |
| Immigrants | Moldova | 96.5 /100 | #115 | Exceptional 96.2% |
| Immigrants | Nonimmigrants | 96.0 /100 | #116 | Exceptional 96.2% |
| Immigrants | Croatia | 96.0 /100 | #117 | Exceptional 96.2% |