Dominican vs Immigrants from Russia 8th Grade
COMPARE
Dominican
Immigrants from Russia
8th Grade
8th Grade Comparison
Dominicans
Immigrants from Russia
92.8%
8TH GRADE
0.0/ 100
METRIC RATING
325th/ 347
METRIC RANK
96.0%
8TH GRADE
80.9/ 100
METRIC RATING
150th/ 347
METRIC RANK
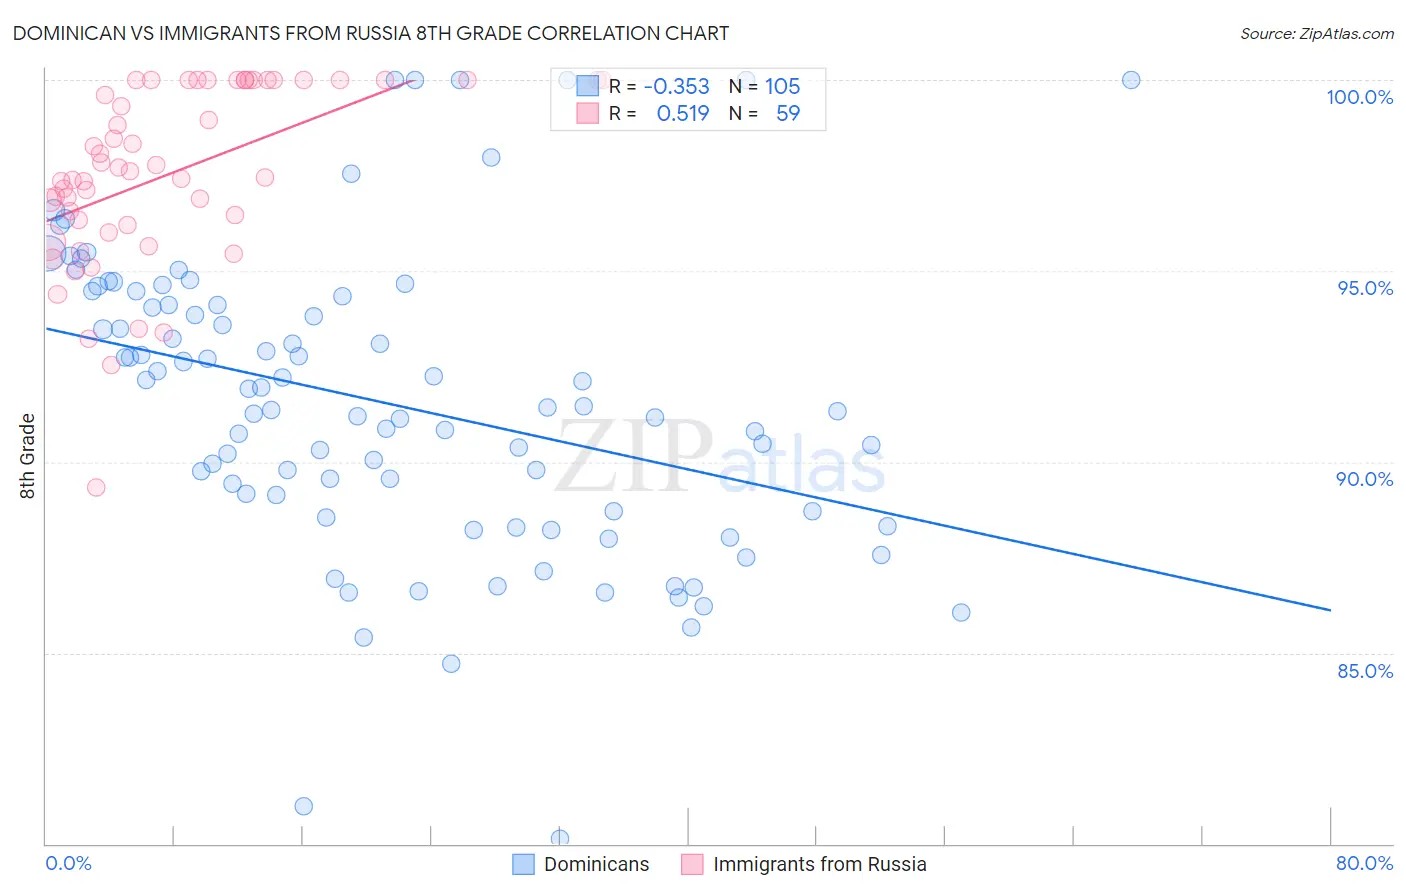
Dominican vs Immigrants from Russia 8th Grade Correlation Chart
The statistical analysis conducted on geographies consisting of 355,142,603 people shows a mild negative correlation between the proportion of Dominicans and percentage of population with at least 8th grade education in the United States with a correlation coefficient (R) of -0.353 and weighted average of 92.8%. Similarly, the statistical analysis conducted on geographies consisting of 347,948,494 people shows a substantial positive correlation between the proportion of Immigrants from Russia and percentage of population with at least 8th grade education in the United States with a correlation coefficient (R) of 0.519 and weighted average of 96.0%, a difference of 3.5%.
8th Grade Correlation Summary
| Measurement | Dominican | Immigrants from Russia |
| Minimum | 80.1% | 89.3% |
| Maximum | 100.0% | 100.0% |
| Range | 19.9% | 10.7% |
| Mean | 91.6% | 97.5% |
| Median | 91.4% | 97.6% |
| Interquartile 25% (IQ1) | 88.7% | 96.2% |
| Interquartile 75% (IQ3) | 94.2% | 100.0% |
| Interquartile Range (IQR) | 5.5% | 3.8% |
| Standard Deviation (Sample) | 3.9% | 2.3% |
| Standard Deviation (Population) | 3.9% | 2.3% |
Similar Demographics by 8th Grade
Demographics Similar to Dominicans by 8th Grade
In terms of 8th grade, the demographic groups most similar to Dominicans are Central American Indian (92.7%, a difference of 0.050%), Nepalese (92.8%, a difference of 0.090%), Immigrants from Belize (92.9%, a difference of 0.16%), Nicaraguan (93.0%, a difference of 0.22%), and Immigrants from the Azores (92.5%, a difference of 0.30%).
| Demographics | Rating | Rank | 8th Grade |
| Puerto Ricans | 0.0 /100 | #318 | Tragic 93.2% |
| Immigrants | Cuba | 0.0 /100 | #319 | Tragic 93.2% |
| Immigrants | Fiji | 0.0 /100 | #320 | Tragic 93.2% |
| Belizeans | 0.0 /100 | #321 | Tragic 93.1% |
| Nicaraguans | 0.0 /100 | #322 | Tragic 93.0% |
| Immigrants | Belize | 0.0 /100 | #323 | Tragic 92.9% |
| Nepalese | 0.0 /100 | #324 | Tragic 92.8% |
| Dominicans | 0.0 /100 | #325 | Tragic 92.8% |
| Central American Indians | 0.0 /100 | #326 | Tragic 92.7% |
| Immigrants | Azores | 0.0 /100 | #327 | Tragic 92.5% |
| Immigrants | Nicaragua | 0.0 /100 | #328 | Tragic 92.5% |
| Immigrants | Cabo Verde | 0.0 /100 | #329 | Tragic 92.4% |
| Immigrants | Armenia | 0.0 /100 | #330 | Tragic 92.3% |
| Hondurans | 0.0 /100 | #331 | Tragic 92.3% |
| Immigrants | Dominican Republic | 0.0 /100 | #332 | Tragic 92.3% |
Demographics Similar to Immigrants from Russia by 8th Grade
In terms of 8th grade, the demographic groups most similar to Immigrants from Russia are Immigrants from Israel (96.0%, a difference of 0.0%), Blackfeet (96.0%, a difference of 0.0%), French American Indian (96.0%, a difference of 0.0%), Immigrants from Jordan (95.9%, a difference of 0.010%), and Albanian (96.0%, a difference of 0.020%).
| Demographics | Rating | Rank | 8th Grade |
| Spanish | 85.1 /100 | #143 | Excellent 96.0% |
| Immigrants | Belarus | 84.8 /100 | #144 | Excellent 96.0% |
| Lumbee | 84.1 /100 | #145 | Excellent 96.0% |
| Israelis | 84.1 /100 | #146 | Excellent 96.0% |
| Colville | 84.0 /100 | #147 | Excellent 96.0% |
| Albanians | 83.1 /100 | #148 | Excellent 96.0% |
| Immigrants | Israel | 81.3 /100 | #149 | Excellent 96.0% |
| Immigrants | Russia | 80.9 /100 | #150 | Excellent 96.0% |
| Blackfeet | 80.8 /100 | #151 | Excellent 96.0% |
| French American Indians | 80.6 /100 | #152 | Excellent 96.0% |
| Immigrants | Jordan | 79.5 /100 | #153 | Good 95.9% |
| Hopi | 79.4 /100 | #154 | Good 95.9% |
| Kenyans | 74.5 /100 | #155 | Good 95.9% |
| Ugandans | 74.1 /100 | #156 | Good 95.9% |
| Immigrants | Taiwan | 70.5 /100 | #157 | Good 95.9% |