Dominican vs Immigrants from Romania Unemployment Among Ages 20 to 24 years
COMPARE
Dominican
Immigrants from Romania
Unemployment Among Ages 20 to 24 years
Unemployment Among Ages 20 to 24 years Comparison
Dominicans
Immigrants from Romania
13.8%
UNEMPLOYMENT AMONG AGES 20 TO 24 YEARS
0.0/ 100
METRIC RATING
329th/ 347
METRIC RANK
10.2%
UNEMPLOYMENT AMONG AGES 20 TO 24 YEARS
75.7/ 100
METRIC RATING
148th/ 347
METRIC RANK
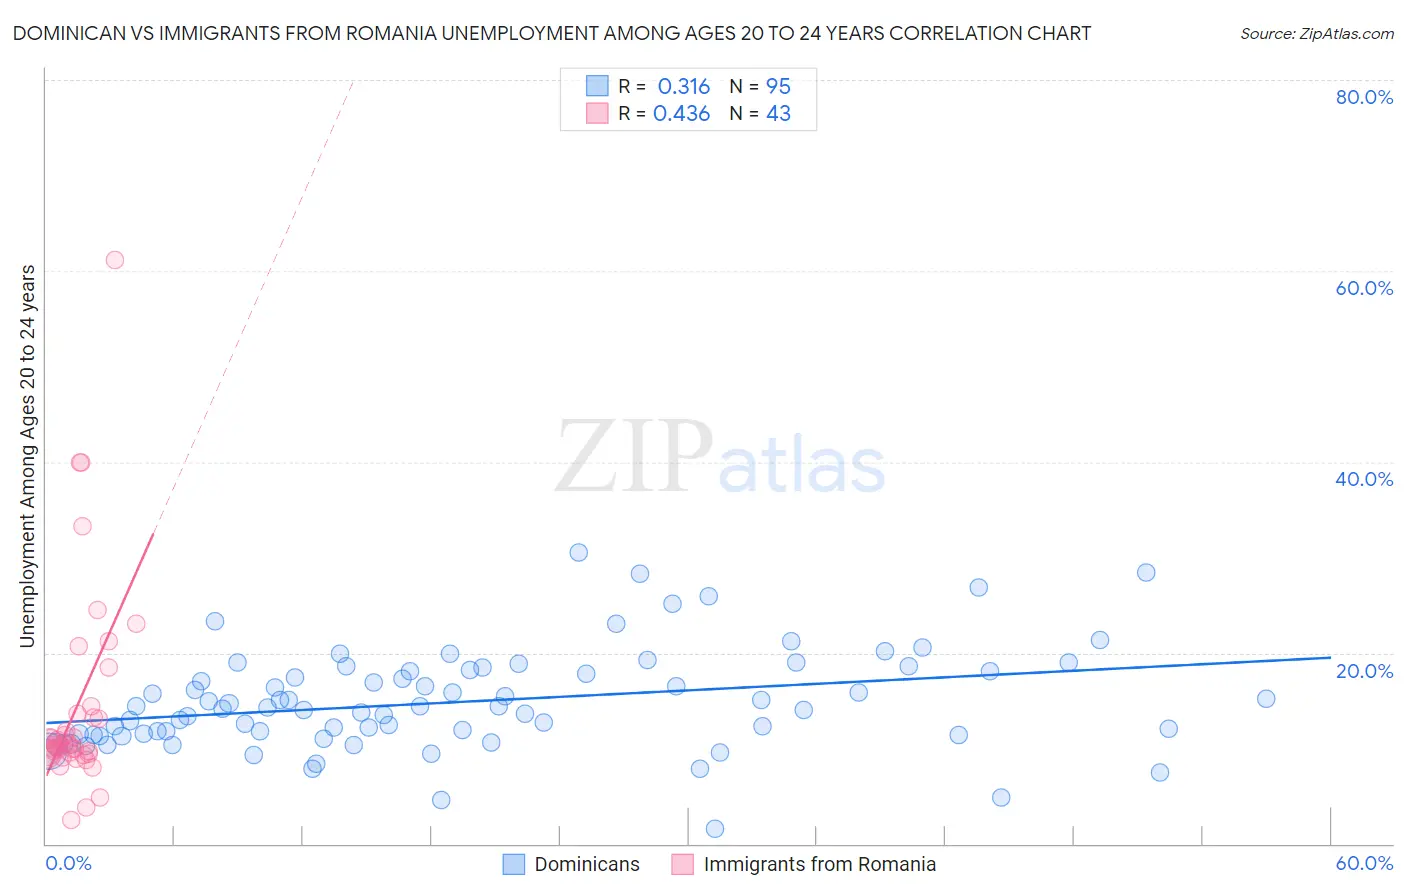
Dominican vs Immigrants from Romania Unemployment Among Ages 20 to 24 years Correlation Chart
The statistical analysis conducted on geographies consisting of 345,593,516 people shows a mild positive correlation between the proportion of Dominicans and unemployment rate among population between the ages 20 and 24 in the United States with a correlation coefficient (R) of 0.316 and weighted average of 13.8%. Similarly, the statistical analysis conducted on geographies consisting of 252,732,931 people shows a moderate positive correlation between the proportion of Immigrants from Romania and unemployment rate among population between the ages 20 and 24 in the United States with a correlation coefficient (R) of 0.436 and weighted average of 10.2%, a difference of 35.2%.
Unemployment Among Ages 20 to 24 years Correlation Summary
| Measurement | Dominican | Immigrants from Romania |
| Minimum | 1.6% | 2.4% |
| Maximum | 30.5% | 61.1% |
| Range | 28.9% | 58.7% |
| Mean | 14.9% | 14.3% |
| Median | 14.3% | 10.3% |
| Interquartile 25% (IQ1) | 11.4% | 9.4% |
| Interquartile 75% (IQ3) | 18.1% | 13.6% |
| Interquartile Range (IQR) | 6.7% | 4.2% |
| Standard Deviation (Sample) | 5.2% | 11.0% |
| Standard Deviation (Population) | 5.2% | 10.8% |
Similar Demographics by Unemployment Among Ages 20 to 24 years
Demographics Similar to Dominicans by Unemployment Among Ages 20 to 24 years
In terms of unemployment among ages 20 to 24 years, the demographic groups most similar to Dominicans are Arapaho (13.8%, a difference of 0.080%), Aleut (13.8%, a difference of 0.35%), Immigrants from Grenada (13.8%, a difference of 0.41%), British West Indian (13.7%, a difference of 0.56%), and Immigrants from Guyana (13.9%, a difference of 0.93%).
| Demographics | Rating | Rank | Unemployment Among Ages 20 to 24 years |
| Natives/Alaskans | 0.0 /100 | #322 | Tragic 13.0% |
| Yakama | 0.0 /100 | #323 | Tragic 13.1% |
| Alaska Natives | 0.0 /100 | #324 | Tragic 13.2% |
| Pueblo | 0.0 /100 | #325 | Tragic 13.2% |
| Immigrants | Barbados | 0.0 /100 | #326 | Tragic 13.5% |
| Immigrants | Dominican Republic | 0.0 /100 | #327 | Tragic 13.6% |
| British West Indians | 0.0 /100 | #328 | Tragic 13.7% |
| Dominicans | 0.0 /100 | #329 | Tragic 13.8% |
| Arapaho | 0.0 /100 | #330 | Tragic 13.8% |
| Aleuts | 0.0 /100 | #331 | Tragic 13.8% |
| Immigrants | Grenada | 0.0 /100 | #332 | Tragic 13.8% |
| Immigrants | Guyana | 0.0 /100 | #333 | Tragic 13.9% |
| Guyanese | 0.0 /100 | #334 | Tragic 14.0% |
| Sioux | 0.0 /100 | #335 | Tragic 14.2% |
| Pima | 0.0 /100 | #336 | Tragic 14.2% |
Demographics Similar to Immigrants from Romania by Unemployment Among Ages 20 to 24 years
In terms of unemployment among ages 20 to 24 years, the demographic groups most similar to Immigrants from Romania are Immigrants from Scotland (10.2%, a difference of 0.060%), Hungarian (10.2%, a difference of 0.060%), French Canadian (10.2%, a difference of 0.090%), Asian (10.2%, a difference of 0.10%), and Immigrants from South Africa (10.2%, a difference of 0.10%).
| Demographics | Rating | Rank | Unemployment Among Ages 20 to 24 years |
| Immigrants | Azores | 81.4 /100 | #141 | Excellent 10.2% |
| Slovaks | 80.2 /100 | #142 | Excellent 10.2% |
| Immigrants | Jordan | 79.0 /100 | #143 | Good 10.2% |
| Brazilians | 78.4 /100 | #144 | Good 10.2% |
| Argentineans | 78.0 /100 | #145 | Good 10.2% |
| Asians | 77.7 /100 | #146 | Good 10.2% |
| French Canadians | 77.5 /100 | #147 | Good 10.2% |
| Immigrants | Romania | 75.7 /100 | #148 | Good 10.2% |
| Immigrants | Scotland | 74.6 /100 | #149 | Good 10.2% |
| Hungarians | 74.4 /100 | #150 | Good 10.2% |
| Immigrants | South Africa | 73.6 /100 | #151 | Good 10.2% |
| Iranians | 72.4 /100 | #152 | Good 10.2% |
| Immigrants | Taiwan | 71.4 /100 | #153 | Good 10.2% |
| Immigrants | Switzerland | 71.3 /100 | #154 | Good 10.2% |
| Lithuanians | 70.0 /100 | #155 | Good 10.2% |