Dominican vs Immigrants from Congo Ambulatory Disability
COMPARE
Dominican
Immigrants from Congo
Ambulatory Disability
Ambulatory Disability Comparison
Dominicans
Immigrants from Congo
7.2%
AMBULATORY DISABILITY
0.0/ 100
METRIC RATING
319th/ 347
METRIC RANK
6.2%
AMBULATORY DISABILITY
18.2/ 100
METRIC RATING
204th/ 347
METRIC RANK
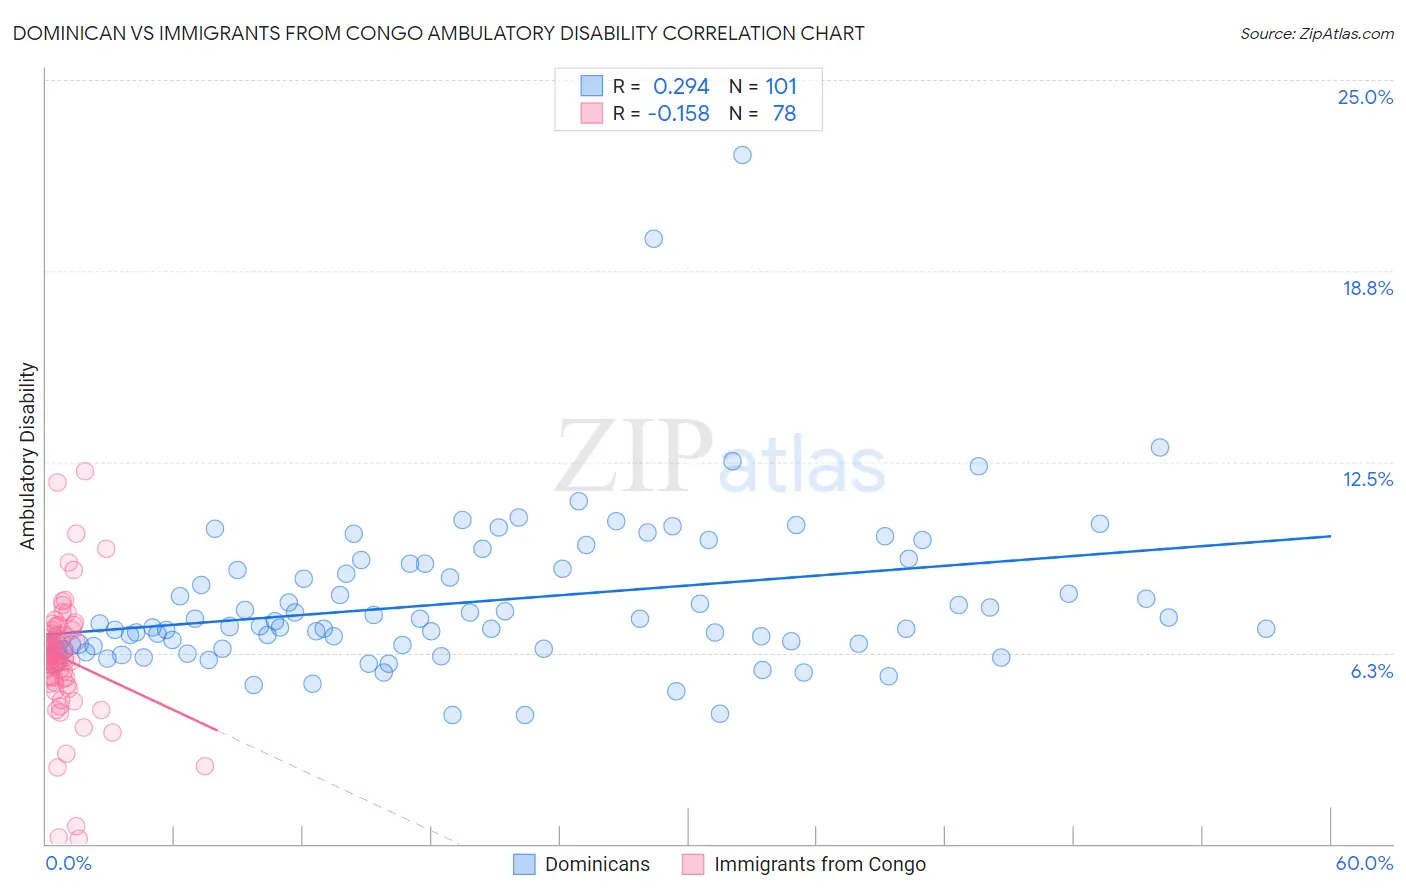
Dominican vs Immigrants from Congo Ambulatory Disability Correlation Chart
The statistical analysis conducted on geographies consisting of 354,945,896 people shows a weak positive correlation between the proportion of Dominicans and percentage of population with ambulatory disability in the United States with a correlation coefficient (R) of 0.294 and weighted average of 7.2%. Similarly, the statistical analysis conducted on geographies consisting of 92,115,389 people shows a poor negative correlation between the proportion of Immigrants from Congo and percentage of population with ambulatory disability in the United States with a correlation coefficient (R) of -0.158 and weighted average of 6.2%, a difference of 15.1%.
Ambulatory Disability Correlation Summary
| Measurement | Dominican | Immigrants from Congo |
| Minimum | 4.2% | 0.17% |
| Maximum | 22.5% | 12.2% |
| Range | 18.3% | 12.0% |
| Mean | 7.9% | 6.1% |
| Median | 7.1% | 6.1% |
| Interquartile 25% (IQ1) | 6.5% | 5.4% |
| Interquartile 75% (IQ3) | 9.1% | 6.9% |
| Interquartile Range (IQR) | 2.6% | 1.5% |
| Standard Deviation (Sample) | 2.6% | 2.0% |
| Standard Deviation (Population) | 2.6% | 2.0% |
Similar Demographics by Ambulatory Disability
Demographics Similar to Dominicans by Ambulatory Disability
In terms of ambulatory disability, the demographic groups most similar to Dominicans are Ottawa (7.2%, a difference of 0.33%), Central American Indian (7.2%, a difference of 0.42%), Immigrants from Dominican Republic (7.1%, a difference of 0.50%), Shoshone (7.1%, a difference of 0.74%), and Blackfeet (7.1%, a difference of 0.76%).
| Demographics | Rating | Rank | Ambulatory Disability |
| Delaware | 0.0 /100 | #312 | Tragic 7.1% |
| Immigrants | Yemen | 0.0 /100 | #313 | Tragic 7.1% |
| Blackfeet | 0.0 /100 | #314 | Tragic 7.1% |
| Shoshone | 0.0 /100 | #315 | Tragic 7.1% |
| Immigrants | Dominican Republic | 0.0 /100 | #316 | Tragic 7.1% |
| Central American Indians | 0.0 /100 | #317 | Tragic 7.2% |
| Ottawa | 0.0 /100 | #318 | Tragic 7.2% |
| Dominicans | 0.0 /100 | #319 | Tragic 7.2% |
| Potawatomi | 0.0 /100 | #320 | Tragic 7.3% |
| Apache | 0.0 /100 | #321 | Tragic 7.4% |
| Osage | 0.0 /100 | #322 | Tragic 7.4% |
| Americans | 0.0 /100 | #323 | Tragic 7.4% |
| Navajo | 0.0 /100 | #324 | Tragic 7.5% |
| Comanche | 0.0 /100 | #325 | Tragic 7.5% |
| Blacks/African Americans | 0.0 /100 | #326 | Tragic 7.5% |
Demographics Similar to Immigrants from Congo by Ambulatory Disability
In terms of ambulatory disability, the demographic groups most similar to Immigrants from Congo are Immigrants from Ukraine (6.2%, a difference of 0.010%), Slovene (6.2%, a difference of 0.020%), Finnish (6.2%, a difference of 0.090%), Albanian (6.2%, a difference of 0.13%), and Immigrants from Central America (6.2%, a difference of 0.15%).
| Demographics | Rating | Rank | Ambulatory Disability |
| Poles | 26.3 /100 | #197 | Fair 6.2% |
| Immigrants | Bangladesh | 24.6 /100 | #198 | Fair 6.2% |
| Italians | 22.6 /100 | #199 | Fair 6.2% |
| Immigrants | Cambodia | 21.5 /100 | #200 | Fair 6.2% |
| Immigrants | Central America | 20.1 /100 | #201 | Fair 6.2% |
| Albanians | 19.7 /100 | #202 | Poor 6.2% |
| Immigrants | Ukraine | 18.4 /100 | #203 | Poor 6.2% |
| Immigrants | Congo | 18.2 /100 | #204 | Poor 6.2% |
| Slovenes | 18.0 /100 | #205 | Poor 6.2% |
| Finns | 17.2 /100 | #206 | Poor 6.2% |
| Alsatians | 15.1 /100 | #207 | Poor 6.3% |
| Bangladeshis | 14.2 /100 | #208 | Poor 6.3% |
| Immigrants | Iraq | 14.0 /100 | #209 | Poor 6.3% |
| Immigrants | Laos | 13.2 /100 | #210 | Poor 6.3% |
| Samoans | 12.1 /100 | #211 | Poor 6.3% |