Delaware vs Swiss Bachelor's Degree
COMPARE
Delaware
Swiss
Bachelor's Degree
Bachelor's Degree Comparison
Delaware
Swiss
33.8%
BACHELOR'S DEGREE
1.2/ 100
METRIC RATING
244th/ 347
METRIC RANK
37.2%
BACHELOR'S DEGREE
34.1/ 100
METRIC RATING
190th/ 347
METRIC RANK
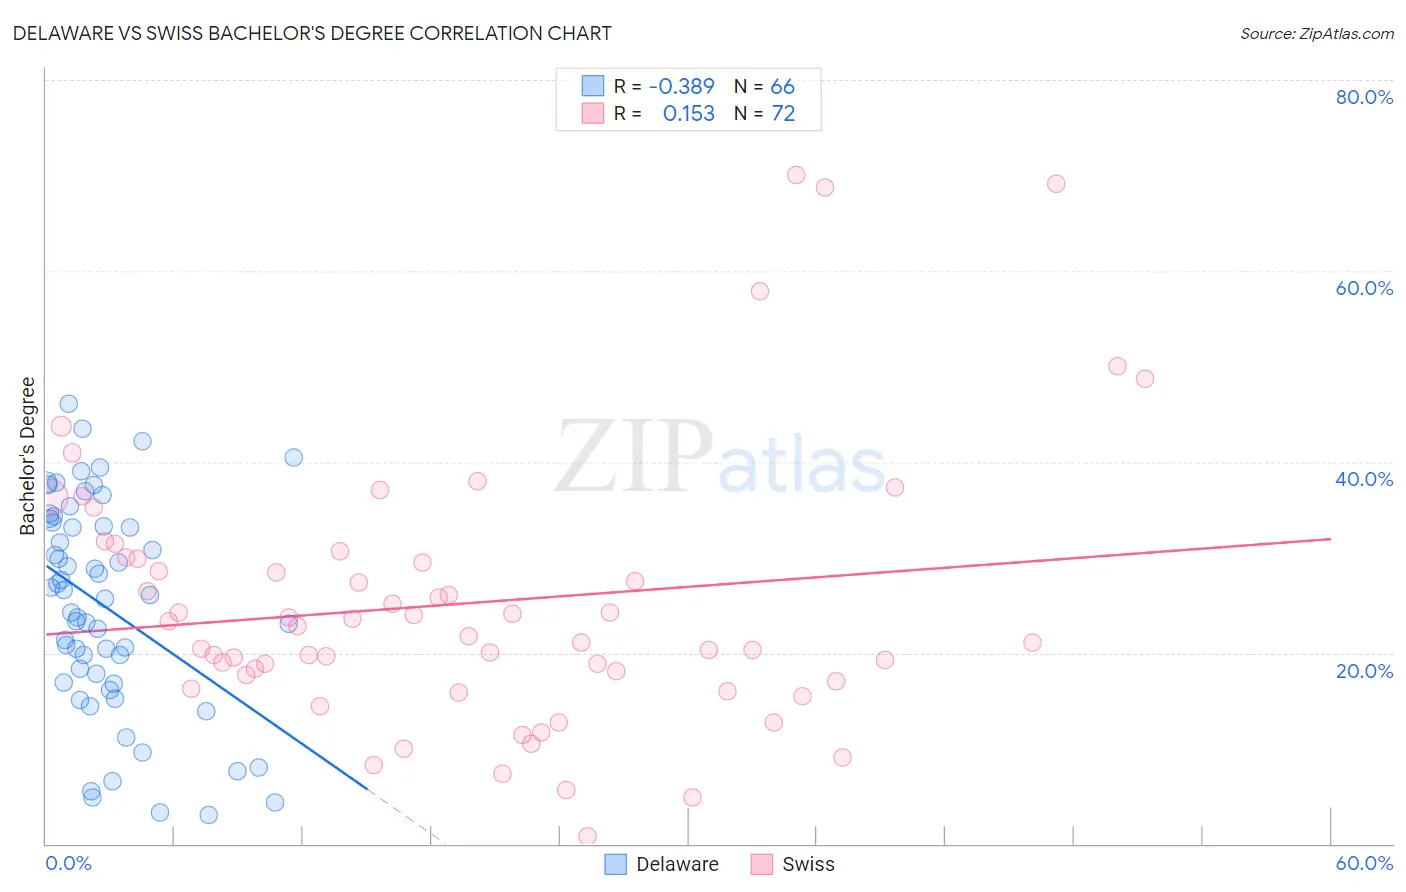
Delaware vs Swiss Bachelor's Degree Correlation Chart
The statistical analysis conducted on geographies consisting of 96,234,889 people shows a mild negative correlation between the proportion of Delaware and percentage of population with at least bachelor's degree education in the United States with a correlation coefficient (R) of -0.389 and weighted average of 33.8%. Similarly, the statistical analysis conducted on geographies consisting of 464,980,651 people shows a poor positive correlation between the proportion of Swiss and percentage of population with at least bachelor's degree education in the United States with a correlation coefficient (R) of 0.153 and weighted average of 37.2%, a difference of 10.2%.
Bachelor's Degree Correlation Summary
| Measurement | Delaware | Swiss |
| Minimum | 3.0% | 0.82% |
| Maximum | 46.1% | 70.0% |
| Range | 43.0% | 69.2% |
| Mean | 24.8% | 25.2% |
| Median | 25.8% | 22.2% |
| Interquartile 25% (IQ1) | 16.9% | 17.3% |
| Interquartile 75% (IQ3) | 33.6% | 29.9% |
| Interquartile Range (IQR) | 16.7% | 12.6% |
| Standard Deviation (Sample) | 11.0% | 14.1% |
| Standard Deviation (Population) | 11.0% | 14.0% |
Similar Demographics by Bachelor's Degree
Demographics Similar to Delaware by Bachelor's Degree
In terms of bachelor's degree, the demographic groups most similar to Delaware are Immigrants from Fiji (33.7%, a difference of 0.090%), Jamaican (33.6%, a difference of 0.45%), Immigrants from Guyana (33.9%, a difference of 0.50%), Immigrants from Congo (33.6%, a difference of 0.54%), and Cree (33.6%, a difference of 0.56%).
| Demographics | Rating | Rank | Bachelor's Degree |
| Tlingit-Haida | 2.8 /100 | #237 | Tragic 34.6% |
| Guyanese | 2.5 /100 | #238 | Tragic 34.5% |
| British West Indians | 2.5 /100 | #239 | Tragic 34.5% |
| Tongans | 2.0 /100 | #240 | Tragic 34.3% |
| Immigrants | Cambodia | 1.9 /100 | #241 | Tragic 34.2% |
| Immigrants | Nonimmigrants | 1.8 /100 | #242 | Tragic 34.2% |
| Immigrants | Guyana | 1.4 /100 | #243 | Tragic 33.9% |
| Delaware | 1.2 /100 | #244 | Tragic 33.8% |
| Immigrants | Fiji | 1.2 /100 | #245 | Tragic 33.7% |
| Jamaicans | 1.0 /100 | #246 | Tragic 33.6% |
| Immigrants | Congo | 1.0 /100 | #247 | Tragic 33.6% |
| Cree | 1.0 /100 | #248 | Tragic 33.6% |
| Immigrants | Liberia | 0.9 /100 | #249 | Tragic 33.5% |
| Indonesians | 0.9 /100 | #250 | Tragic 33.5% |
| Japanese | 0.7 /100 | #251 | Tragic 33.3% |
Demographics Similar to Swiss by Bachelor's Degree
In terms of bachelor's degree, the demographic groups most similar to Swiss are Nigerian (37.2%, a difference of 0.020%), Immigrants from Vietnam (37.1%, a difference of 0.22%), Yugoslavian (37.1%, a difference of 0.29%), Slovak (37.3%, a difference of 0.30%), and Immigrants from Oceania (37.3%, a difference of 0.35%).
| Demographics | Rating | Rank | Bachelor's Degree |
| Senegalese | 42.2 /100 | #183 | Average 37.5% |
| Scandinavians | 41.7 /100 | #184 | Average 37.5% |
| Immigrants | Peru | 41.3 /100 | #185 | Average 37.5% |
| Norwegians | 40.4 /100 | #186 | Average 37.5% |
| English | 39.7 /100 | #187 | Fair 37.4% |
| Immigrants | Oceania | 37.3 /100 | #188 | Fair 37.3% |
| Slovaks | 36.9 /100 | #189 | Fair 37.3% |
| Swiss | 34.1 /100 | #190 | Fair 37.2% |
| Nigerians | 33.9 /100 | #191 | Fair 37.2% |
| Immigrants | Vietnam | 32.1 /100 | #192 | Fair 37.1% |
| Yugoslavians | 31.5 /100 | #193 | Fair 37.1% |
| Belgians | 29.9 /100 | #194 | Fair 37.0% |
| Koreans | 29.8 /100 | #195 | Fair 37.0% |
| Celtics | 29.5 /100 | #196 | Fair 37.0% |
| Czechoslovakians | 29.2 /100 | #197 | Fair 37.0% |