Delaware vs Carpatho Rusyn Bachelor's Degree
COMPARE
Delaware
Carpatho Rusyn
Bachelor's Degree
Bachelor's Degree Comparison
Delaware
Carpatho Rusyns
33.8%
BACHELOR'S DEGREE
1.2/ 100
METRIC RATING
244th/ 347
METRIC RANK
42.1%
BACHELOR'S DEGREE
99.0/ 100
METRIC RATING
87th/ 347
METRIC RANK
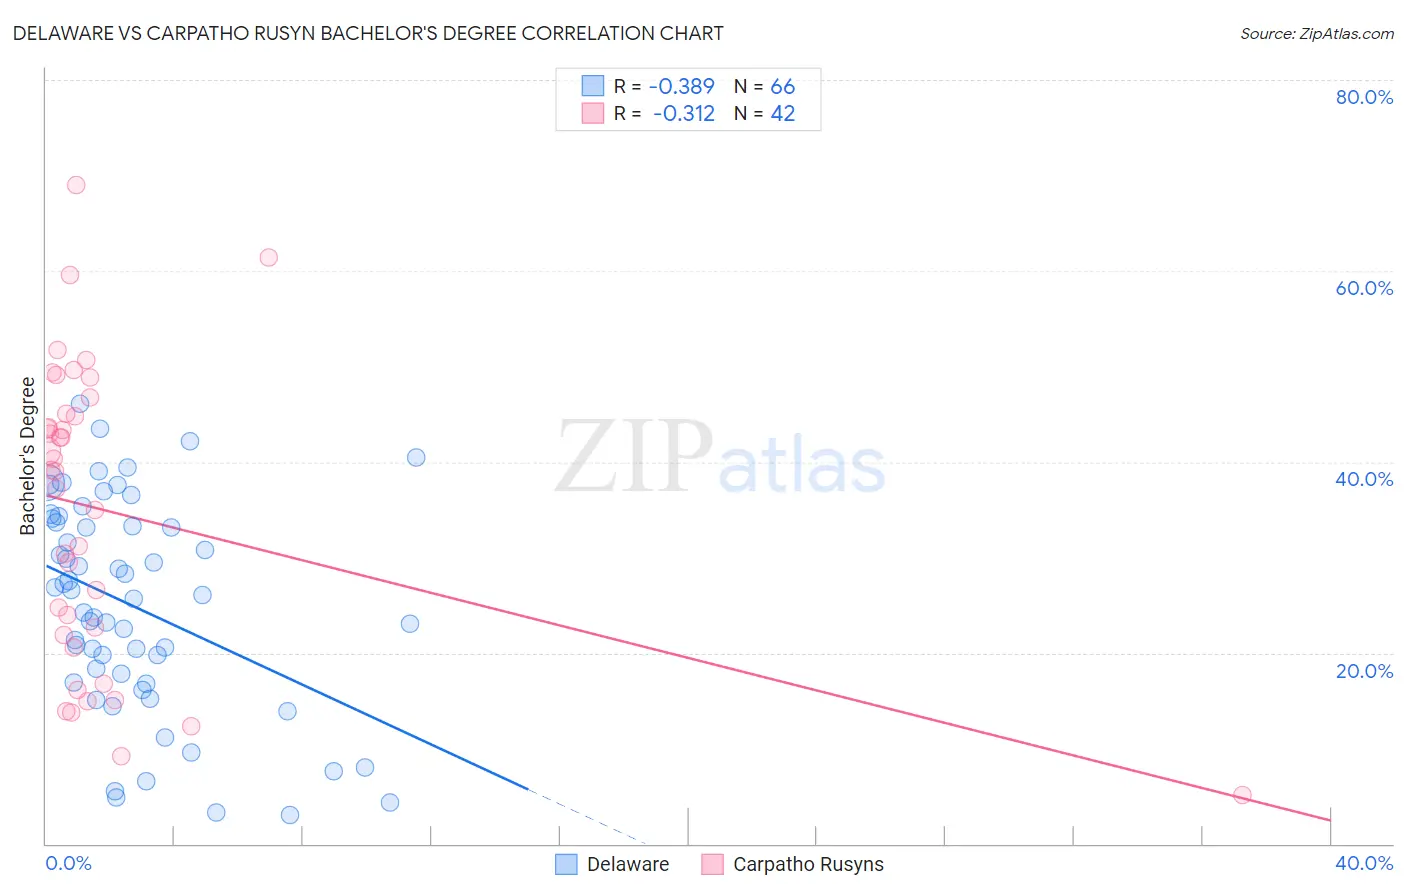
Delaware vs Carpatho Rusyn Bachelor's Degree Correlation Chart
The statistical analysis conducted on geographies consisting of 96,234,889 people shows a mild negative correlation between the proportion of Delaware and percentage of population with at least bachelor's degree education in the United States with a correlation coefficient (R) of -0.389 and weighted average of 33.8%. Similarly, the statistical analysis conducted on geographies consisting of 58,871,690 people shows a mild negative correlation between the proportion of Carpatho Rusyns and percentage of population with at least bachelor's degree education in the United States with a correlation coefficient (R) of -0.312 and weighted average of 42.1%, a difference of 24.6%.
Bachelor's Degree Correlation Summary
| Measurement | Delaware | Carpatho Rusyn |
| Minimum | 3.0% | 5.1% |
| Maximum | 46.1% | 69.0% |
| Range | 43.0% | 63.9% |
| Mean | 24.8% | 34.9% |
| Median | 25.8% | 39.1% |
| Interquartile 25% (IQ1) | 16.9% | 21.8% |
| Interquartile 75% (IQ3) | 33.6% | 45.0% |
| Interquartile Range (IQR) | 16.7% | 23.2% |
| Standard Deviation (Sample) | 11.0% | 15.6% |
| Standard Deviation (Population) | 11.0% | 15.4% |
Similar Demographics by Bachelor's Degree
Demographics Similar to Delaware by Bachelor's Degree
In terms of bachelor's degree, the demographic groups most similar to Delaware are Immigrants from Fiji (33.7%, a difference of 0.090%), Jamaican (33.6%, a difference of 0.45%), Immigrants from Guyana (33.9%, a difference of 0.50%), Immigrants from Congo (33.6%, a difference of 0.54%), and Cree (33.6%, a difference of 0.56%).
| Demographics | Rating | Rank | Bachelor's Degree |
| Tlingit-Haida | 2.8 /100 | #237 | Tragic 34.6% |
| Guyanese | 2.5 /100 | #238 | Tragic 34.5% |
| British West Indians | 2.5 /100 | #239 | Tragic 34.5% |
| Tongans | 2.0 /100 | #240 | Tragic 34.3% |
| Immigrants | Cambodia | 1.9 /100 | #241 | Tragic 34.2% |
| Immigrants | Nonimmigrants | 1.8 /100 | #242 | Tragic 34.2% |
| Immigrants | Guyana | 1.4 /100 | #243 | Tragic 33.9% |
| Delaware | 1.2 /100 | #244 | Tragic 33.8% |
| Immigrants | Fiji | 1.2 /100 | #245 | Tragic 33.7% |
| Jamaicans | 1.0 /100 | #246 | Tragic 33.6% |
| Immigrants | Congo | 1.0 /100 | #247 | Tragic 33.6% |
| Cree | 1.0 /100 | #248 | Tragic 33.6% |
| Immigrants | Liberia | 0.9 /100 | #249 | Tragic 33.5% |
| Indonesians | 0.9 /100 | #250 | Tragic 33.5% |
| Japanese | 0.7 /100 | #251 | Tragic 33.3% |
Demographics Similar to Carpatho Rusyns by Bachelor's Degree
In terms of bachelor's degree, the demographic groups most similar to Carpatho Rusyns are Immigrants from Western Europe (42.0%, a difference of 0.12%), Greek (42.0%, a difference of 0.12%), Laotian (42.0%, a difference of 0.25%), Immigrants from Brazil (42.2%, a difference of 0.30%), and Immigrants from Northern Africa (41.9%, a difference of 0.35%).
| Demographics | Rating | Rank | Bachelor's Degree |
| Immigrants | Croatia | 99.2 /100 | #80 | Exceptional 42.3% |
| Immigrants | Hungary | 99.2 /100 | #81 | Exceptional 42.3% |
| Immigrants | Scotland | 99.2 /100 | #82 | Exceptional 42.3% |
| Armenians | 99.2 /100 | #83 | Exceptional 42.3% |
| Immigrants | Western Asia | 99.2 /100 | #84 | Exceptional 42.3% |
| Lithuanians | 99.2 /100 | #85 | Exceptional 42.2% |
| Immigrants | Brazil | 99.2 /100 | #86 | Exceptional 42.2% |
| Carpatho Rusyns | 99.0 /100 | #87 | Exceptional 42.1% |
| Immigrants | Western Europe | 99.0 /100 | #88 | Exceptional 42.0% |
| Greeks | 99.0 /100 | #89 | Exceptional 42.0% |
| Laotians | 98.9 /100 | #90 | Exceptional 42.0% |
| Immigrants | Northern Africa | 98.9 /100 | #91 | Exceptional 41.9% |
| Maltese | 98.8 /100 | #92 | Exceptional 41.9% |
| Immigrants | Canada | 98.6 /100 | #93 | Exceptional 41.7% |
| Immigrants | Nepal | 98.6 /100 | #94 | Exceptional 41.7% |