Delaware vs Swiss Median Family Income

COMPARE

Delaware
Race
Ancestry
AfghanAfricanAlaska NativeAlaskan AthabascanAlbanianAleutAlsatianAmericanApacheArabArapahoArgentineanArmenianAssyrian/Chaldean/SyriacAustralianAustrianBahamianBangladeshiBarbadianBasqueBelgianBelizeanBermudanBhutaneseBlackfeetBolivianBrazilianBritishBritish West IndianBulgarianBurmeseCajunCambodianCanadianCape VerdeanCarpatho RusynCelticCentral AmericanCentral American IndianCherokeeCheyenneChickasawChileanChineseChippewaChoctawColombianColvilleComancheCosta RicanCreeCreekCroatianCrowCubanCypriotCzechCzechoslovakianDanishDelawareDominicanDutchDutch West IndianEastern EuropeanEcuadorianEgyptianEnglishEstonianEthiopianEuropeanFijianFilipinoFinnishFrenchFrench American IndianFrench CanadianGermanGerman RussianGhanaianGreekGuamanian/ChamorroGuatemalanGuyaneseHaitianHmongHonduranHopiHoumaHungarianIcelanderIndian (Asian)IndonesianInupiatIranianIraqiIrishIroquoisIsraeliItalianJamaicanJapaneseJordanianKenyanKiowaKoreanLaotianLatvianLebaneseLiberianLithuanianLumbeeLuxembourgerMacedonianMalaysianMalteseMarshalleseMenomineeMexicanMexican American IndianMongolianMoroccanNative HawaiianNavajoNepaleseNew ZealanderNicaraguanNigerianNorthern EuropeanNorwegianOkinawanOsageOttawaPaiutePakistaniPalestinianPanamanianParaguayanPennsylvania GermanPeruvianPimaPolishPortuguesePotawatomiPuebloPuerto RicanPuget Sound SalishRomanianRussianSalvadoranSamoanScandinavianScotch-IrishScottishSeminoleSenegaleseSerbianShoshoneSierra LeoneanSiouxSlavicSlovakSloveneSomaliSouth AfricanSouth AmericanSouth American IndianSoviet UnionSpaniardSpanishSpanish AmericanSpanish American IndianSri LankanSubsaharan AfricanSudaneseSwedishSyrianTaiwaneseThaiTlingit-HaidaTohono O'OdhamTonganTrinidadian and TobagonianTsimshianTurkishU.S. Virgin IslanderUgandanUkrainianUruguayanUteVenezuelanVietnameseWelshWest IndianYakamaYaquiYugoslavianYumanYup'ikZimbabwean
Immigration
NonimmigrantsImmigrantsAfghanistanAfricaAlbaniaArgentinaArmeniaAsiaAustraliaAustriaBahamasBangladeshBarbadosBelarusBelgiumBelizeBoliviaBosnia and HerzegovinaBrazilBulgariaBurma/MyanmarCabo VerdeCambodiaCameroonCanadaCaribbeanCentral AmericaChileChinaColombiaCongoCosta RicaCroatiaCubaCzechoslovakiaDenmarkDominicaDominican RepublicEastern AfricaEastern AsiaEastern EuropeEcuadorEgyptEl SalvadorEnglandEritreaEthiopiaEuropeFijiFranceGermanyGhanaGreeceGrenadaGuatemalaGuyanaHaitiHondurasHong KongHungaryIndiaIndonesiaIranIraqIrelandIsraelItalyJamaicaJapanJordanKazakhstanKenyaKoreaKuwaitLaosLatin AmericaLatviaLebanonLiberiaLithuaniaMalaysiaMexicoMicronesiaMiddle AfricaMoldovaMoroccoNepalNetherlandsNicaraguaNigeriaNorth AmericaNorth MacedoniaNorthern AfricaNorthern EuropeNorwayOceaniaPakistanPanamaPeruPhilippinesPolandPortugalRomaniaRussiaSaudi ArabiaScotlandSenegalSerbiaSierra LeoneSingaporeSomaliaSouth AfricaSouth AmericaSouth Central AsiaSouth Eastern AsiaSouthern EuropeSpainSri LankaSt. Vincent and the GrenadinesSudanSwedenSwitzerlandSyriaTaiwanThailandTrinidad and TobagoTurkeyUgandaUkraineUruguayUzbekistanVenezuelaVietnamWest IndiesWestern AfricaWestern AsiaWestern EuropeYemenZaireZimbabweAzores
Swiss
Race
Ancestry
AfghanAfricanAlaska NativeAlaskan AthabascanAlbanianAleutAlsatianAmericanApacheArabArapahoArgentineanArmenianAssyrian/Chaldean/SyriacAustralianAustrianBahamianBangladeshiBarbadianBasqueBelgianBelizeanBermudanBhutaneseBlackfeetBolivianBrazilianBritishBritish West IndianBulgarianBurmeseCajunCambodianCanadianCape VerdeanCarpatho RusynCelticCentral AmericanCentral American IndianCherokeeCheyenneChickasawChileanChineseChippewaChoctawColombianColvilleComancheCosta RicanCreeCreekCroatianCrowCubanCypriotCzechCzechoslovakianDanishDominicanDutchDutch West IndianEastern EuropeanEcuadorianEgyptianEnglishEstonianEthiopianEuropeanFijianFilipinoFinnishFrenchFrench American IndianFrench CanadianGermanGerman RussianGhanaianGreekGuamanian/ChamorroGuatemalanGuyaneseHaitianHmongHonduranHopiHoumaHungarianIcelanderIndian (Asian)IndonesianInupiatIranianIraqiIrishIroquoisIsraeliItalianJamaicanJapaneseJordanianKenyanKiowaKoreanLaotianLatvianLebaneseLiberianLithuanianLumbeeLuxembourgerMacedonianMalaysianMalteseMarshalleseMenomineeMexicanMexican American IndianMongolianMoroccanNative HawaiianNavajoNepaleseNew ZealanderNicaraguanNigerianNorthern EuropeanNorwegianOkinawanOsageOttawaPaiutePakistaniPalestinianPanamanianParaguayanPennsylvania GermanPeruvianPimaPolishPortuguesePotawatomiPuebloPuerto RicanPuget Sound SalishRomanianRussianSalvadoranSamoanScandinavianScotch-IrishScottishSeminoleSenegaleseSerbianShoshoneSierra LeoneanSiouxSlavicSlovakSloveneSomaliSouth AfricanSouth AmericanSouth American IndianSoviet UnionSpaniardSpanishSpanish AmericanSpanish American IndianSri LankanSubsaharan AfricanSudaneseSwedishSwissSyrianTaiwaneseThaiTlingit-HaidaTohono O'OdhamTonganTrinidadian and TobagonianTsimshianTurkishU.S. Virgin IslanderUgandanUkrainianUruguayanUteVenezuelanVietnameseWelshWest IndianYakamaYaquiYugoslavianYumanYup'ikZimbabwean
Immigration
NonimmigrantsImmigrantsAfghanistanAfricaAlbaniaArgentinaArmeniaAsiaAustraliaAustriaBahamasBangladeshBarbadosBelarusBelgiumBelizeBoliviaBosnia and HerzegovinaBrazilBulgariaBurma/MyanmarCabo VerdeCambodiaCameroonCanadaCaribbeanCentral AmericaChileChinaColombiaCongoCosta RicaCroatiaCubaCzechoslovakiaDenmarkDominicaDominican RepublicEastern AfricaEastern AsiaEastern EuropeEcuadorEgyptEl SalvadorEnglandEritreaEthiopiaEuropeFijiFranceGermanyGhanaGreeceGrenadaGuatemalaGuyanaHaitiHondurasHong KongHungaryIndiaIndonesiaIranIraqIrelandIsraelItalyJamaicaJapanJordanKazakhstanKenyaKoreaKuwaitLaosLatin AmericaLatviaLebanonLiberiaLithuaniaMalaysiaMexicoMicronesiaMiddle AfricaMoldovaMoroccoNepalNetherlandsNicaraguaNigeriaNorth AmericaNorth MacedoniaNorthern AfricaNorthern EuropeNorwayOceaniaPakistanPanamaPeruPhilippinesPolandPortugalRomaniaRussiaSaudi ArabiaScotlandSenegalSerbiaSierra LeoneSingaporeSomaliaSouth AfricaSouth AmericaSouth Central AsiaSouth Eastern AsiaSouthern EuropeSpainSri LankaSt. Vincent and the GrenadinesSudanSwedenSwitzerlandSyriaTaiwanThailandTrinidad and TobagoTurkeyUgandaUkraineUruguayUzbekistanVenezuelaVietnamWest IndiesWestern AfricaWestern AsiaWestern EuropeYemenZaireZimbabweAzores
Median Family Income
Income
Poverty
Unemployment
Labor Participation
Family Structure
Vehicle Availability
Education Level
Disability

Median Family Income Comparison

Delaware

Swiss

Tragic
Good
$96,958
MEDIAN FAMILY INCOME
5.1/ 100
METRIC RATING
219th/ 347
METRIC RANK
$104,396
MEDIAN FAMILY INCOME
70.7/ 100
METRIC RATING
159th/ 347
METRIC RANK

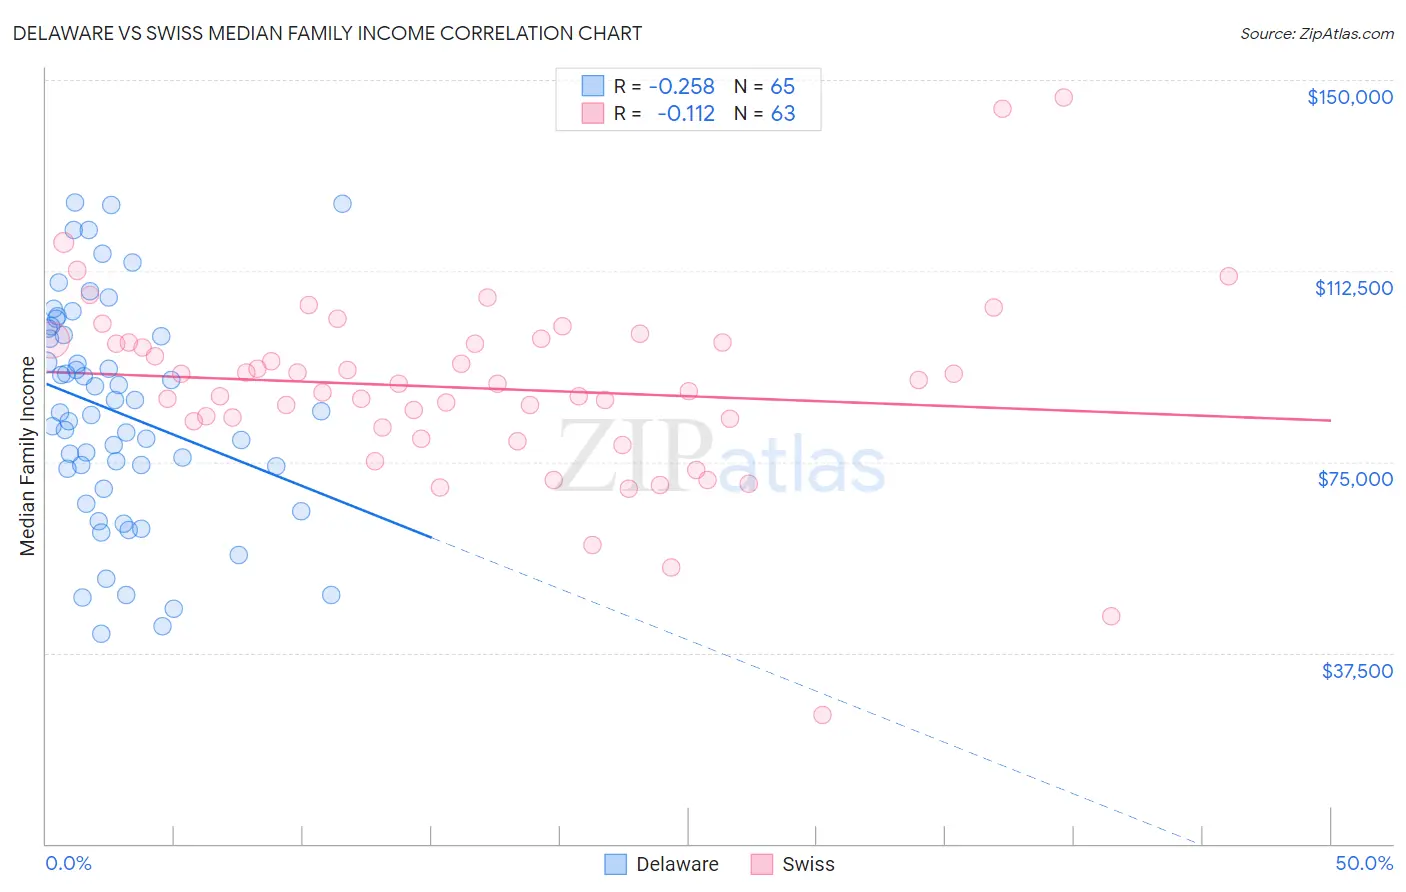
Delaware vs Swiss Median Family Income Correlation Chart

The statistical analysis conducted on geographies consisting of 96,215,498 people shows a weak negative correlation between the proportion of Delaware and median family income in the United States with a correlation coefficient (R) of -0.258 and weighted average of $96,958. Similarly, the statistical analysis conducted on geographies consisting of 464,558,670 people shows a poor negative correlation between the proportion of Swiss and median family income in the United States with a correlation coefficient (R) of -0.112 and weighted average of $104,396, a difference of 7.7%.
Delaware vs Swiss Median Family Income

Median Family Income Correlation Summary

MeasurementDelawareSwiss
Minimum$41,165$25,401
Maximum$125,926$146,603
Range$84,761$121,202
Mean$84,700$89,459
Median$84,783$90,414
Interquartile 25% (IQ1)$71,717$81,791
Interquartile 75% (IQ3)$100,612$98,522
Interquartile Range (IQR)$28,895$16,731
Standard Deviation (Sample)$21,556$18,875
Standard Deviation (Population)$21,389$18,724

Similar Demographics by Median Family Income

Demographics Similar to Delaware by Median Family Income

In terms of median family income, the demographic groups most similar to Delaware are Sudanese ($96,783, a difference of 0.18%), Immigrants from Cambodia ($97,222, a difference of 0.27%), Japanese ($97,288, a difference of 0.34%), Immigrants from Ghana ($96,544, a difference of 0.43%), and Immigrants from Bosnia and Herzegovina ($97,432, a difference of 0.49%).
DemographicsRating | RankMedian Family Income
Panamanians
7.2
/100
|
#212
Tragic
$97,683
Immigrants | Armenia
7.0
/100
|
#213
Tragic
$97,605
Bermudans
6.9
/100
|
#214
Tragic
$97,577
Nigerians
6.7
/100
|
#215
Tragic
$97,522
Immigrants | Bosnia and Herzegovina
6.4
/100
|
#216
Tragic
$97,432
Japanese
6.0
/100
|
#217
Tragic
$97,288
Immigrants | Cambodia
5.8
/100
|
#218
Tragic
$97,222
Delaware
5.1
/100
|
#219
Tragic
$96,958
Sudanese
4.7
/100
|
#220
Tragic
$96,783
Immigrants | Ghana
4.2
/100
|
#221
Tragic
$96,544
Immigrants | Nigeria
4.0
/100
|
#222
Tragic
$96,439
Venezuelans
3.7
/100
|
#223
Tragic
$96,281
Immigrants | Nonimmigrants
3.6
/100
|
#224
Tragic
$96,231
Vietnamese
3.4
/100
|
#225
Tragic
$96,123
Immigrants | Panama
2.7
/100
|
#226
Tragic
$95,647

Demographics Similar to Swiss by Median Family Income

In terms of median family income, the demographic groups most similar to Swiss are Scandinavian ($104,410, a difference of 0.010%), Moroccan ($104,488, a difference of 0.090%), Scottish ($104,288, a difference of 0.10%), Icelander ($104,282, a difference of 0.11%), and Basque ($104,760, a difference of 0.35%).
DemographicsRating | RankMedian Family Income
Immigrants | Albania
79.1
/100
|
#152
Good
$105,285
Slavs
77.9
/100
|
#153
Good
$105,144
Immigrants | Nepal
76.3
/100
|
#154
Good
$104,966
Native Hawaiians
75.8
/100
|
#155
Good
$104,910
Basques
74.4
/100
|
#156
Good
$104,760
Moroccans
71.6
/100
|
#157
Good
$104,488
Scandinavians
70.8
/100
|
#158
Good
$104,410
Swiss
70.7
/100
|
#159
Good
$104,396
Scottish
69.5
/100
|
#160
Good
$104,288
Icelanders
69.4
/100
|
#161
Good
$104,282
Immigrants | Sierra Leone
66.2
/100
|
#162
Good
$103,990
Costa Ricans
66.2
/100
|
#163
Good
$103,989
Sierra Leoneans
64.7
/100
|
#164
Good
$103,859
Slovaks
63.1
/100
|
#165
Good
$103,729
English
62.6
/100
|
#166
Good
$103,684