Immigrants from Jamaica vs Swiss Bachelor's Degree
COMPARE
Immigrants from Jamaica
Swiss
Bachelor's Degree
Bachelor's Degree Comparison
Immigrants from Jamaica
Swiss
32.9%
BACHELOR'S DEGREE
0.5/ 100
METRIC RATING
262nd/ 347
METRIC RANK
37.2%
BACHELOR'S DEGREE
34.1/ 100
METRIC RATING
190th/ 347
METRIC RANK
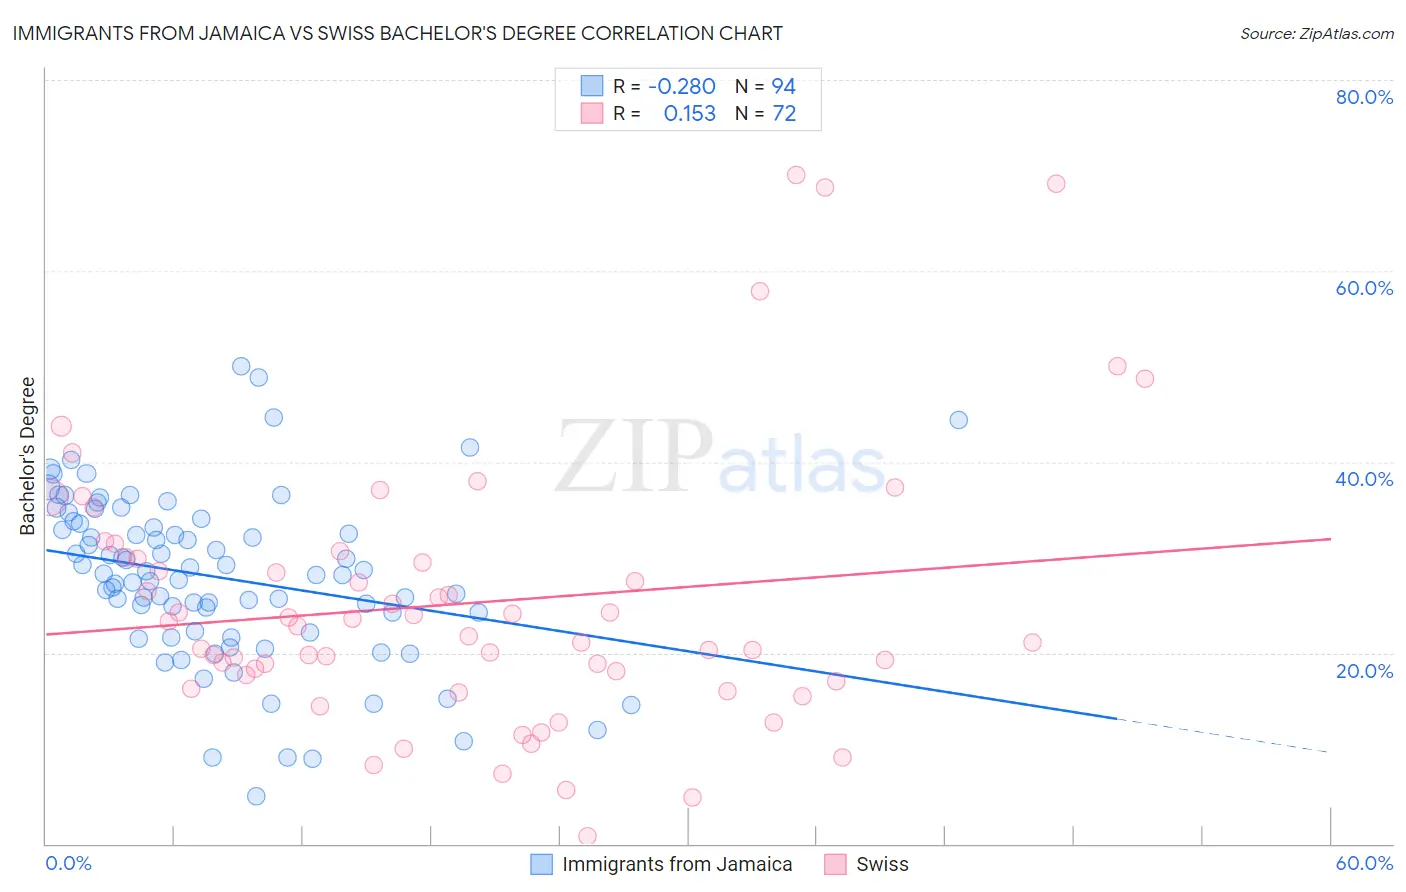
Immigrants from Jamaica vs Swiss Bachelor's Degree Correlation Chart
The statistical analysis conducted on geographies consisting of 301,812,649 people shows a weak negative correlation between the proportion of Immigrants from Jamaica and percentage of population with at least bachelor's degree education in the United States with a correlation coefficient (R) of -0.280 and weighted average of 32.9%. Similarly, the statistical analysis conducted on geographies consisting of 464,980,651 people shows a poor positive correlation between the proportion of Swiss and percentage of population with at least bachelor's degree education in the United States with a correlation coefficient (R) of 0.153 and weighted average of 37.2%, a difference of 13.2%.
Bachelor's Degree Correlation Summary
| Measurement | Immigrants from Jamaica | Swiss |
| Minimum | 4.9% | 0.82% |
| Maximum | 50.0% | 70.0% |
| Range | 45.0% | 69.2% |
| Mean | 27.9% | 25.2% |
| Median | 28.2% | 22.2% |
| Interquartile 25% (IQ1) | 22.3% | 17.3% |
| Interquartile 75% (IQ3) | 33.6% | 29.9% |
| Interquartile Range (IQR) | 11.2% | 12.6% |
| Standard Deviation (Sample) | 8.7% | 14.1% |
| Standard Deviation (Population) | 8.7% | 14.0% |
Similar Demographics by Bachelor's Degree
Demographics Similar to Immigrants from Jamaica by Bachelor's Degree
In terms of bachelor's degree, the demographic groups most similar to Immigrants from Jamaica are African (32.9%, a difference of 0.0%), Malaysian (32.9%, a difference of 0.090%), Belizean (32.8%, a difference of 0.29%), Osage (33.0%, a difference of 0.45%), and French American Indian (33.1%, a difference of 0.50%).
| Demographics | Rating | Rank | Bachelor's Degree |
| Iroquois | 0.7 /100 | #255 | Tragic 33.2% |
| Nicaraguans | 0.6 /100 | #256 | Tragic 33.1% |
| Spanish Americans | 0.6 /100 | #257 | Tragic 33.1% |
| French American Indians | 0.6 /100 | #258 | Tragic 33.1% |
| Osage | 0.5 /100 | #259 | Tragic 33.0% |
| Malaysians | 0.5 /100 | #260 | Tragic 32.9% |
| Africans | 0.5 /100 | #261 | Tragic 32.9% |
| Immigrants | Jamaica | 0.5 /100 | #262 | Tragic 32.9% |
| Belizeans | 0.4 /100 | #263 | Tragic 32.8% |
| Central American Indians | 0.3 /100 | #264 | Tragic 32.5% |
| Bahamians | 0.3 /100 | #265 | Tragic 32.5% |
| Immigrants | Dominica | 0.3 /100 | #266 | Tragic 32.5% |
| Cubans | 0.3 /100 | #267 | Tragic 32.5% |
| Immigrants | Portugal | 0.2 /100 | #268 | Tragic 32.2% |
| Immigrants | Belize | 0.2 /100 | #269 | Tragic 32.1% |
Demographics Similar to Swiss by Bachelor's Degree
In terms of bachelor's degree, the demographic groups most similar to Swiss are Nigerian (37.2%, a difference of 0.020%), Immigrants from Vietnam (37.1%, a difference of 0.22%), Yugoslavian (37.1%, a difference of 0.29%), Slovak (37.3%, a difference of 0.30%), and Immigrants from Oceania (37.3%, a difference of 0.35%).
| Demographics | Rating | Rank | Bachelor's Degree |
| Senegalese | 42.2 /100 | #183 | Average 37.5% |
| Scandinavians | 41.7 /100 | #184 | Average 37.5% |
| Immigrants | Peru | 41.3 /100 | #185 | Average 37.5% |
| Norwegians | 40.4 /100 | #186 | Average 37.5% |
| English | 39.7 /100 | #187 | Fair 37.4% |
| Immigrants | Oceania | 37.3 /100 | #188 | Fair 37.3% |
| Slovaks | 36.9 /100 | #189 | Fair 37.3% |
| Swiss | 34.1 /100 | #190 | Fair 37.2% |
| Nigerians | 33.9 /100 | #191 | Fair 37.2% |
| Immigrants | Vietnam | 32.1 /100 | #192 | Fair 37.1% |
| Yugoslavians | 31.5 /100 | #193 | Fair 37.1% |
| Belgians | 29.9 /100 | #194 | Fair 37.0% |
| Koreans | 29.8 /100 | #195 | Fair 37.0% |
| Celtics | 29.5 /100 | #196 | Fair 37.0% |
| Czechoslovakians | 29.2 /100 | #197 | Fair 37.0% |