Hungarian vs Swiss Bachelor's Degree
COMPARE
Hungarian
Swiss
Bachelor's Degree
Bachelor's Degree Comparison
Hungarians
Swiss
38.3%
BACHELOR'S DEGREE
62.1/ 100
METRIC RATING
164th/ 347
METRIC RANK
37.2%
BACHELOR'S DEGREE
34.1/ 100
METRIC RATING
190th/ 347
METRIC RANK
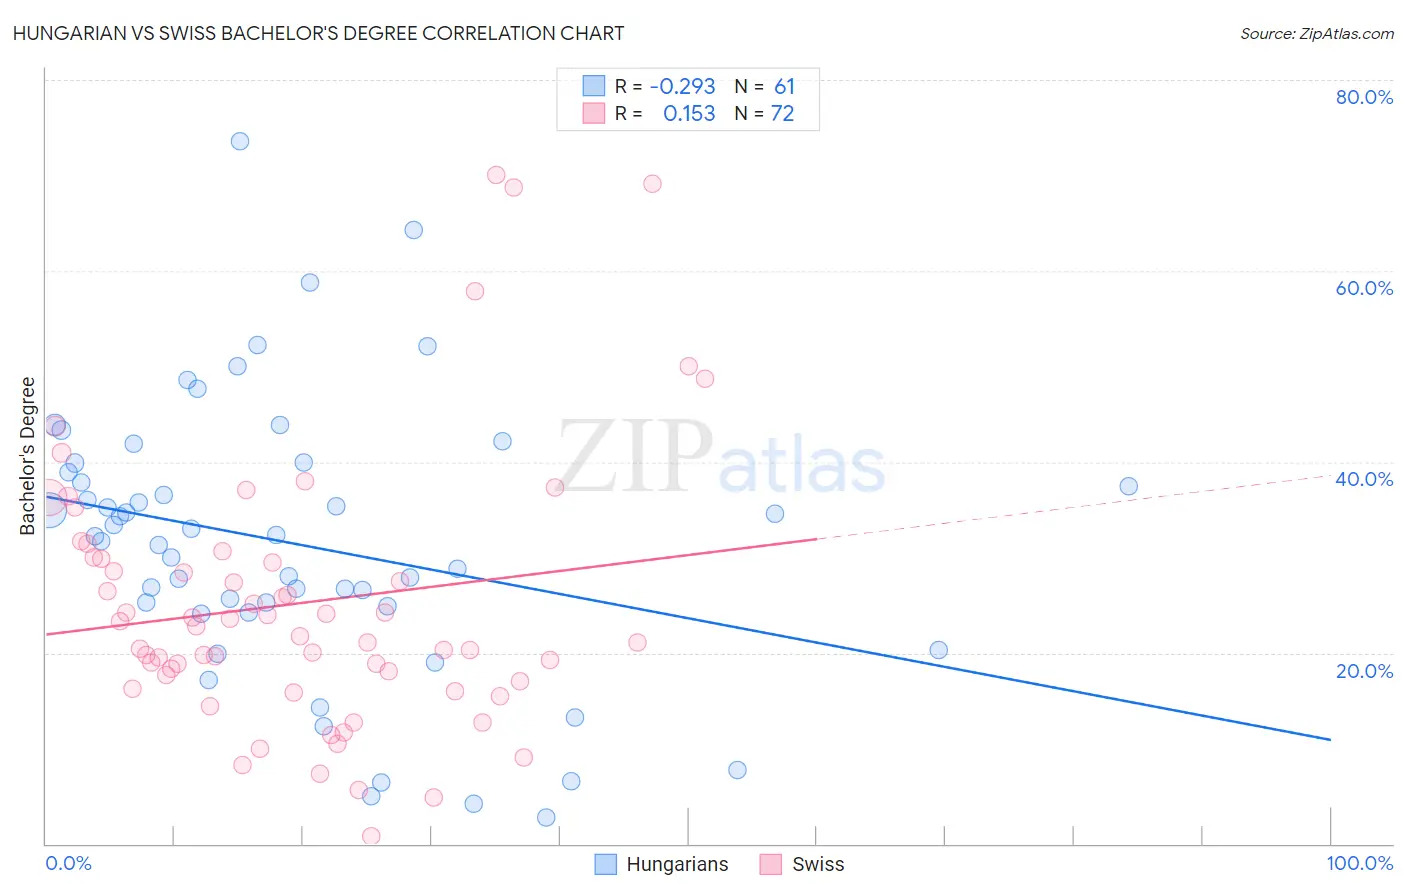
Hungarian vs Swiss Bachelor's Degree Correlation Chart
The statistical analysis conducted on geographies consisting of 486,195,655 people shows a weak negative correlation between the proportion of Hungarians and percentage of population with at least bachelor's degree education in the United States with a correlation coefficient (R) of -0.293 and weighted average of 38.3%. Similarly, the statistical analysis conducted on geographies consisting of 464,980,651 people shows a poor positive correlation between the proportion of Swiss and percentage of population with at least bachelor's degree education in the United States with a correlation coefficient (R) of 0.153 and weighted average of 37.2%, a difference of 2.9%.
Bachelor's Degree Correlation Summary
| Measurement | Hungarian | Swiss |
| Minimum | 2.7% | 0.82% |
| Maximum | 73.6% | 70.0% |
| Range | 70.9% | 69.2% |
| Mean | 31.4% | 25.2% |
| Median | 32.2% | 22.2% |
| Interquartile 25% (IQ1) | 24.5% | 17.3% |
| Interquartile 75% (IQ3) | 39.4% | 29.9% |
| Interquartile Range (IQR) | 14.9% | 12.6% |
| Standard Deviation (Sample) | 14.5% | 14.1% |
| Standard Deviation (Population) | 14.3% | 14.0% |
Similar Demographics by Bachelor's Degree
Demographics Similar to Hungarians by Bachelor's Degree
In terms of bachelor's degree, the demographic groups most similar to Hungarians are Peruvian (38.3%, a difference of 0.14%), Sri Lankan (38.2%, a difference of 0.30%), Colombian (38.4%, a difference of 0.31%), Somali (38.1%, a difference of 0.35%), and Uruguayan (38.4%, a difference of 0.38%).
| Demographics | Rating | Rank | Bachelor's Degree |
| Immigrants | South America | 70.1 /100 | #157 | Good 38.6% |
| Immigrants | Germany | 69.6 /100 | #158 | Good 38.6% |
| Chinese | 66.6 /100 | #159 | Good 38.5% |
| Vietnamese | 66.6 /100 | #160 | Good 38.5% |
| Uruguayans | 65.8 /100 | #161 | Good 38.4% |
| Colombians | 65.0 /100 | #162 | Good 38.4% |
| Peruvians | 63.4 /100 | #163 | Good 38.3% |
| Hungarians | 62.1 /100 | #164 | Good 38.3% |
| Sri Lankans | 59.1 /100 | #165 | Average 38.2% |
| Somalis | 58.6 /100 | #166 | Average 38.1% |
| Scottish | 56.6 /100 | #167 | Average 38.1% |
| Danes | 56.2 /100 | #168 | Average 38.1% |
| Ghanaians | 55.3 /100 | #169 | Average 38.0% |
| Czechs | 54.4 /100 | #170 | Average 38.0% |
| Bermudans | 54.2 /100 | #171 | Average 38.0% |
Demographics Similar to Swiss by Bachelor's Degree
In terms of bachelor's degree, the demographic groups most similar to Swiss are Nigerian (37.2%, a difference of 0.020%), Immigrants from Vietnam (37.1%, a difference of 0.22%), Yugoslavian (37.1%, a difference of 0.29%), Slovak (37.3%, a difference of 0.30%), and Immigrants from Oceania (37.3%, a difference of 0.35%).
| Demographics | Rating | Rank | Bachelor's Degree |
| Senegalese | 42.2 /100 | #183 | Average 37.5% |
| Scandinavians | 41.7 /100 | #184 | Average 37.5% |
| Immigrants | Peru | 41.3 /100 | #185 | Average 37.5% |
| Norwegians | 40.4 /100 | #186 | Average 37.5% |
| English | 39.7 /100 | #187 | Fair 37.4% |
| Immigrants | Oceania | 37.3 /100 | #188 | Fair 37.3% |
| Slovaks | 36.9 /100 | #189 | Fair 37.3% |
| Swiss | 34.1 /100 | #190 | Fair 37.2% |
| Nigerians | 33.9 /100 | #191 | Fair 37.2% |
| Immigrants | Vietnam | 32.1 /100 | #192 | Fair 37.1% |
| Yugoslavians | 31.5 /100 | #193 | Fair 37.1% |
| Belgians | 29.9 /100 | #194 | Fair 37.0% |
| Koreans | 29.8 /100 | #195 | Fair 37.0% |
| Celtics | 29.5 /100 | #196 | Fair 37.0% |
| Czechoslovakians | 29.2 /100 | #197 | Fair 37.0% |