Delaware vs Swiss Married-couple Households
COMPARE
Delaware
Swiss
Married-couple Households
Married-couple Households Comparison
Delaware
Swiss
46.8%
MARRIED-COUPLE HOUSEHOLDS
71.2/ 100
METRIC RATING
161st/ 347
METRIC RANK
49.9%
MARRIED-COUPLE HOUSEHOLDS
100.0/ 100
METRIC RATING
12th/ 347
METRIC RANK
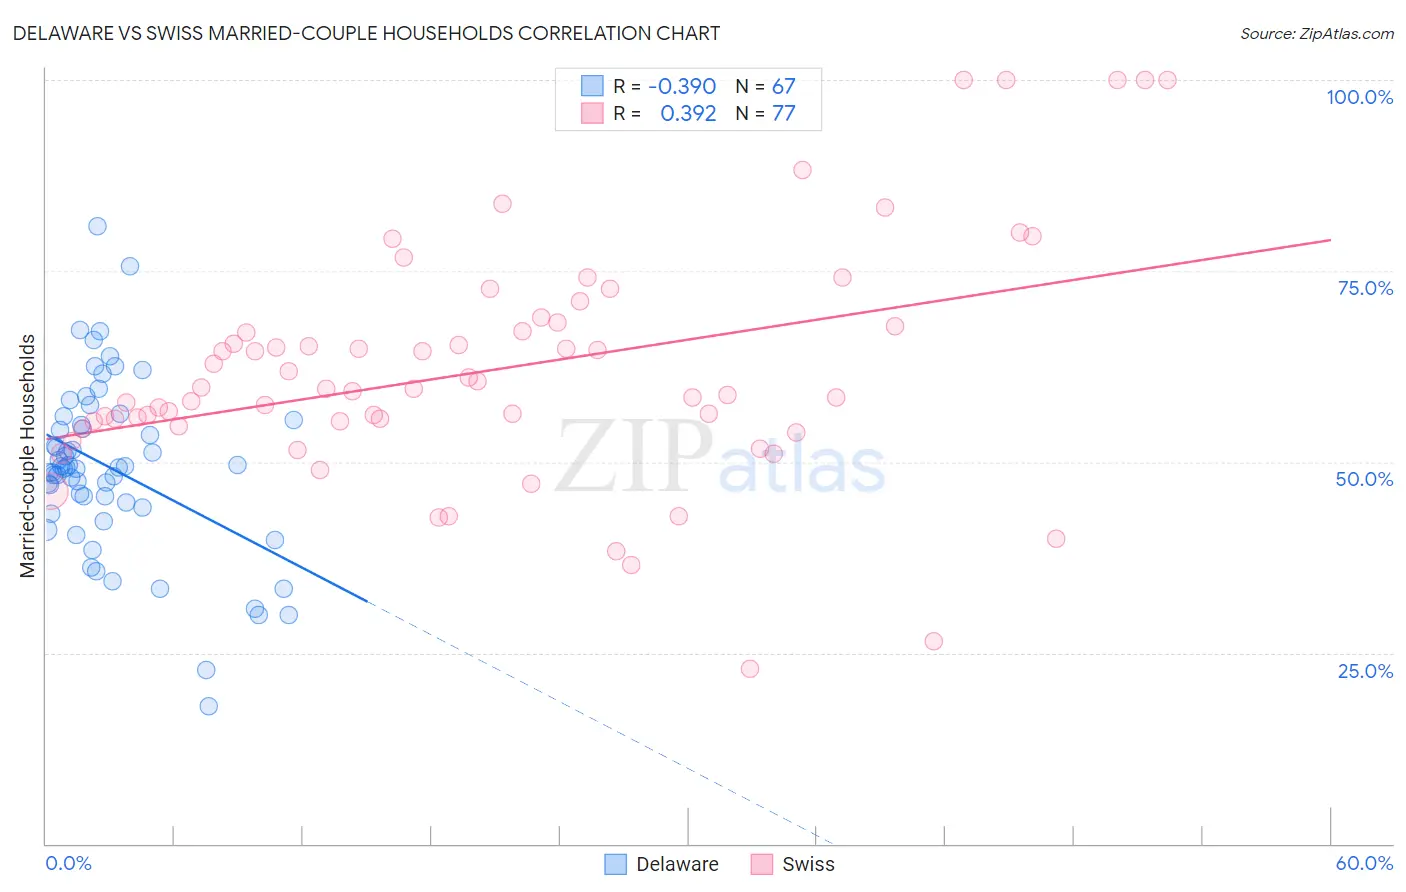
Delaware vs Swiss Married-couple Households Correlation Chart
The statistical analysis conducted on geographies consisting of 96,227,266 people shows a mild negative correlation between the proportion of Delaware and percentage of married-couple family households in the United States with a correlation coefficient (R) of -0.390 and weighted average of 46.8%. Similarly, the statistical analysis conducted on geographies consisting of 464,742,560 people shows a mild positive correlation between the proportion of Swiss and percentage of married-couple family households in the United States with a correlation coefficient (R) of 0.392 and weighted average of 49.9%, a difference of 6.6%.
Married-couple Households Correlation Summary
| Measurement | Delaware | Swiss |
| Minimum | 18.0% | 23.0% |
| Maximum | 80.9% | 100.0% |
| Range | 62.9% | 77.0% |
| Mean | 49.2% | 62.1% |
| Median | 49.3% | 59.6% |
| Interquartile 25% (IQ1) | 44.0% | 55.0% |
| Interquartile 75% (IQ3) | 55.4% | 67.9% |
| Interquartile Range (IQR) | 11.4% | 12.9% |
| Standard Deviation (Sample) | 11.3% | 15.5% |
| Standard Deviation (Population) | 11.3% | 15.4% |
Similar Demographics by Married-couple Households
Demographics Similar to Delaware by Married-couple Households
In terms of married-couple households, the demographic groups most similar to Delaware are Colombian (46.8%, a difference of 0.010%), Iraqi (46.9%, a difference of 0.020%), Immigrants from Turkey (46.8%, a difference of 0.040%), Immigrants from Kazakhstan (46.8%, a difference of 0.060%), and Immigrants from Southern Europe (46.8%, a difference of 0.060%).
| Demographics | Rating | Rank | Married-couple Households |
| Immigrants | Western Asia | 76.1 /100 | #154 | Good 46.9% |
| Arabs | 76.0 /100 | #155 | Good 46.9% |
| Armenians | 75.4 /100 | #156 | Good 46.9% |
| Immigrants | Oceania | 74.8 /100 | #157 | Good 46.9% |
| Immigrants | Nonimmigrants | 73.3 /100 | #158 | Good 46.9% |
| Osage | 73.2 /100 | #159 | Good 46.9% |
| Iraqis | 71.7 /100 | #160 | Good 46.9% |
| Delaware | 71.2 /100 | #161 | Good 46.8% |
| Colombians | 71.0 /100 | #162 | Good 46.8% |
| Immigrants | Turkey | 70.2 /100 | #163 | Good 46.8% |
| Immigrants | Kazakhstan | 70.0 /100 | #164 | Good 46.8% |
| Immigrants | Southern Europe | 69.9 /100 | #165 | Good 46.8% |
| Cherokee | 65.7 /100 | #166 | Good 46.7% |
| Immigrants | Croatia | 64.2 /100 | #167 | Good 46.7% |
| Israelis | 62.3 /100 | #168 | Good 46.7% |
Demographics Similar to Swiss by Married-couple Households
In terms of married-couple households, the demographic groups most similar to Swiss are Immigrants from Korea (49.9%, a difference of 0.17%), Burmese (49.8%, a difference of 0.30%), Immigrants from Pakistan (50.1%, a difference of 0.37%), Korean (49.7%, a difference of 0.44%), and Swedish (49.7%, a difference of 0.47%).
| Demographics | Rating | Rank | Married-couple Households |
| Tongans | 100.0 /100 | #5 | Exceptional 51.6% |
| Danes | 100.0 /100 | #6 | Exceptional 51.1% |
| Filipinos | 100.0 /100 | #7 | Exceptional 51.0% |
| Immigrants | South Central Asia | 100.0 /100 | #8 | Exceptional 50.6% |
| Pennsylvania Germans | 100.0 /100 | #9 | Exceptional 50.4% |
| Chinese | 100.0 /100 | #10 | Exceptional 50.4% |
| Immigrants | Pakistan | 100.0 /100 | #11 | Exceptional 50.1% |
| Swiss | 100.0 /100 | #12 | Exceptional 49.9% |
| Immigrants | Korea | 100.0 /100 | #13 | Exceptional 49.9% |
| Burmese | 100.0 /100 | #14 | Exceptional 49.8% |
| Koreans | 99.9 /100 | #15 | Exceptional 49.7% |
| Swedes | 99.9 /100 | #16 | Exceptional 49.7% |
| Immigrants | Hong Kong | 99.9 /100 | #17 | Exceptional 49.6% |
| English | 99.9 /100 | #18 | Exceptional 49.6% |
| Europeans | 99.9 /100 | #19 | Exceptional 49.6% |