British West Indian vs Immigrants from Vietnam Associate's Degree
COMPARE
British West Indian
Immigrants from Vietnam
Associate's Degree
Associate's Degree Comparison
British West Indians
Immigrants from Vietnam
42.4%
ASSOCIATE'S DEGREE
1.0/ 100
METRIC RATING
241st/ 347
METRIC RANK
45.2%
ASSOCIATE'S DEGREE
20.8/ 100
METRIC RATING
201st/ 347
METRIC RANK
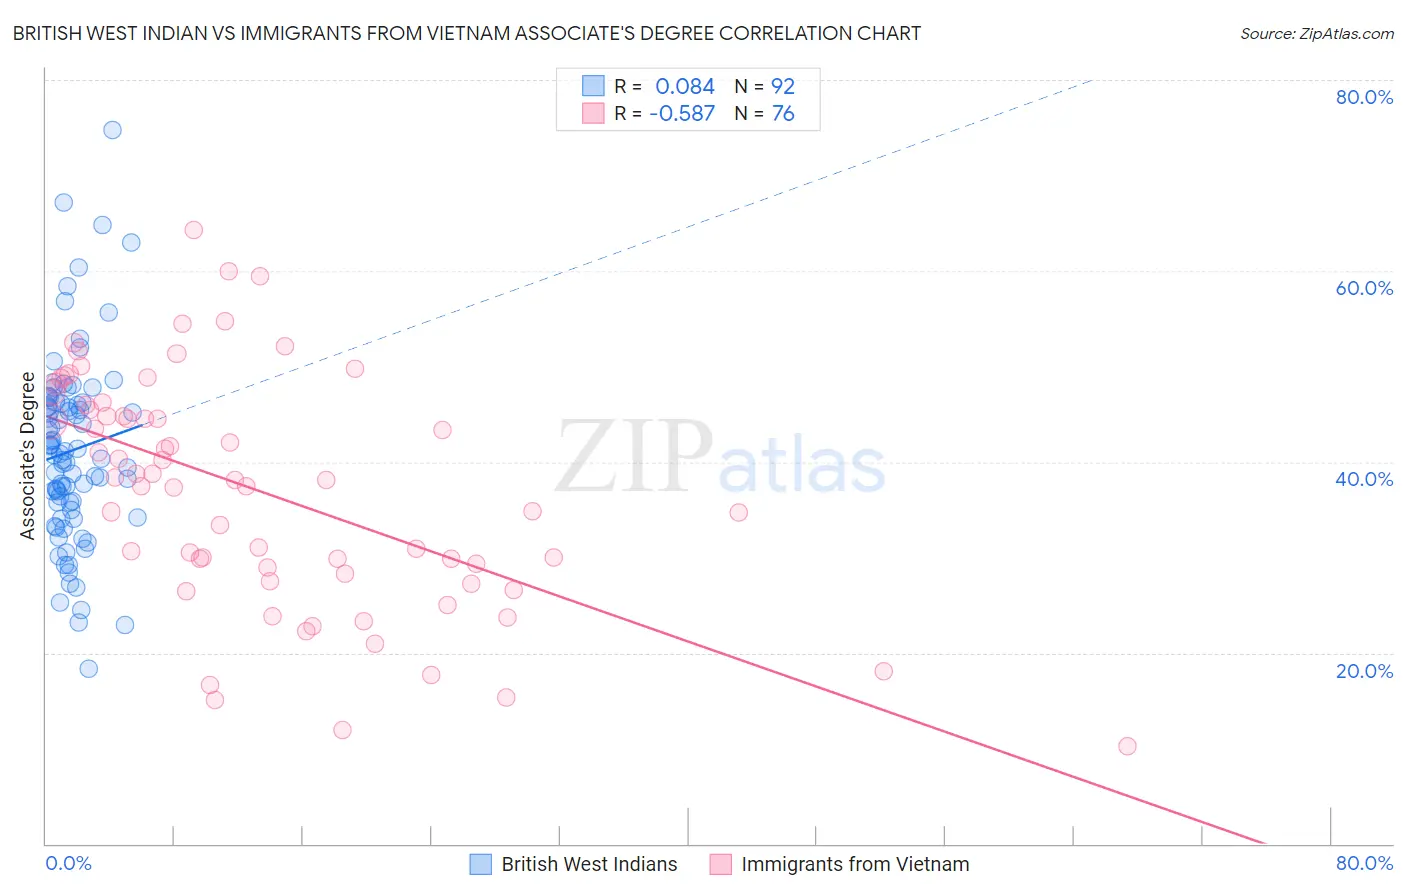
British West Indian vs Immigrants from Vietnam Associate's Degree Correlation Chart
The statistical analysis conducted on geographies consisting of 152,683,655 people shows a slight positive correlation between the proportion of British West Indians and percentage of population with at least associate's degree education in the United States with a correlation coefficient (R) of 0.084 and weighted average of 42.4%. Similarly, the statistical analysis conducted on geographies consisting of 404,825,690 people shows a substantial negative correlation between the proportion of Immigrants from Vietnam and percentage of population with at least associate's degree education in the United States with a correlation coefficient (R) of -0.587 and weighted average of 45.2%, a difference of 6.6%.
Associate's Degree Correlation Summary
| Measurement | British West Indian | Immigrants from Vietnam |
| Minimum | 18.3% | 10.2% |
| Maximum | 74.7% | 64.3% |
| Range | 56.4% | 54.0% |
| Mean | 41.2% | 36.9% |
| Median | 40.8% | 38.1% |
| Interquartile 25% (IQ1) | 35.3% | 28.6% |
| Interquartile 75% (IQ3) | 46.2% | 45.7% |
| Interquartile Range (IQR) | 10.9% | 17.1% |
| Standard Deviation (Sample) | 9.9% | 12.1% |
| Standard Deviation (Population) | 9.8% | 12.0% |
Similar Demographics by Associate's Degree
Demographics Similar to British West Indians by Associate's Degree
In terms of associate's degree, the demographic groups most similar to British West Indians are Immigrants from West Indies (42.4%, a difference of 0.010%), Guyanese (42.3%, a difference of 0.12%), Immigrants from Liberia (42.3%, a difference of 0.26%), Immigrants from Cambodia (42.3%, a difference of 0.28%), and Delaware (42.3%, a difference of 0.31%).
| Demographics | Rating | Rank | Associate's Degree |
| Tlingit-Haida | 2.1 /100 | #234 | Tragic 43.0% |
| Ecuadorians | 2.0 /100 | #235 | Tragic 43.0% |
| Immigrants | St. Vincent and the Grenadines | 1.9 /100 | #236 | Tragic 42.9% |
| Immigrants | Nonimmigrants | 1.9 /100 | #237 | Tragic 42.9% |
| Iroquois | 1.7 /100 | #238 | Tragic 42.8% |
| Immigrants | Grenada | 1.3 /100 | #239 | Tragic 42.6% |
| Cree | 1.2 /100 | #240 | Tragic 42.5% |
| British West Indians | 1.0 /100 | #241 | Tragic 42.4% |
| Immigrants | West Indies | 1.0 /100 | #242 | Tragic 42.4% |
| Guyanese | 1.0 /100 | #243 | Tragic 42.3% |
| Immigrants | Liberia | 0.9 /100 | #244 | Tragic 42.3% |
| Immigrants | Cambodia | 0.9 /100 | #245 | Tragic 42.3% |
| Delaware | 0.9 /100 | #246 | Tragic 42.3% |
| Immigrants | Fiji | 0.8 /100 | #247 | Tragic 42.2% |
| Immigrants | Ecuador | 0.8 /100 | #248 | Tragic 42.2% |
Demographics Similar to Immigrants from Vietnam by Associate's Degree
In terms of associate's degree, the demographic groups most similar to Immigrants from Vietnam are Senegalese (45.2%, a difference of 0.030%), Immigrants from Senegal (45.2%, a difference of 0.040%), Spaniard (45.2%, a difference of 0.050%), Immigrants from Bangladesh (45.2%, a difference of 0.060%), and Immigrants from South Eastern Asia (45.2%, a difference of 0.070%).
| Demographics | Rating | Rank | Associate's Degree |
| Immigrants | Peru | 27.6 /100 | #194 | Fair 45.5% |
| Germans | 26.5 /100 | #195 | Fair 45.5% |
| French | 25.6 /100 | #196 | Fair 45.4% |
| Scotch-Irish | 22.3 /100 | #197 | Fair 45.3% |
| Immigrants | Bangladesh | 21.3 /100 | #198 | Fair 45.2% |
| Immigrants | Senegal | 21.2 /100 | #199 | Fair 45.2% |
| Senegalese | 21.1 /100 | #200 | Fair 45.2% |
| Immigrants | Vietnam | 20.8 /100 | #201 | Fair 45.2% |
| Spaniards | 20.4 /100 | #202 | Fair 45.2% |
| Immigrants | South Eastern Asia | 20.2 /100 | #203 | Fair 45.2% |
| Nigerians | 19.1 /100 | #204 | Poor 45.1% |
| Immigrants | Thailand | 18.9 /100 | #205 | Poor 45.1% |
| German Russians | 18.9 /100 | #206 | Poor 45.1% |
| Panamanians | 18.4 /100 | #207 | Poor 45.1% |
| Dutch | 17.6 /100 | #208 | Poor 45.0% |