Immigrants from Taiwan vs Immigrants from Vietnam Associate's Degree

COMPARE

Immigrants from Taiwan
Race
Ancestry
AfghanAfricanAlaska NativeAlaskan AthabascanAlbanianAleutAlsatianAmericanApacheArabArapahoArgentineanArmenianAssyrian/Chaldean/SyriacAustralianAustrianBahamianBangladeshiBarbadianBasqueBelgianBelizeanBermudanBhutaneseBlackfeetBolivianBrazilianBritishBritish West IndianBulgarianBurmeseCajunCambodianCanadianCape VerdeanCarpatho RusynCelticCentral AmericanCentral American IndianCherokeeCheyenneChickasawChileanChineseChippewaChoctawColombianColvilleComancheCosta RicanCreeCreekCroatianCrowCubanCypriotCzechCzechoslovakianDanishDelawareDominicanDutchDutch West IndianEastern EuropeanEcuadorianEgyptianEnglishEstonianEthiopianEuropeanFijianFilipinoFinnishFrenchFrench American IndianFrench CanadianGermanGerman RussianGhanaianGreekGuamanian/ChamorroGuatemalanGuyaneseHaitianHmongHonduranHopiHoumaHungarianIcelanderIndian (Asian)IndonesianInupiatIranianIraqiIrishIroquoisIsraeliItalianJamaicanJapaneseJordanianKenyanKiowaKoreanLaotianLatvianLebaneseLiberianLithuanianLumbeeLuxembourgerMacedonianMalaysianMalteseMarshalleseMenomineeMexicanMexican American IndianMongolianMoroccanNative HawaiianNavajoNepaleseNew ZealanderNicaraguanNigerianNorthern EuropeanNorwegianOkinawanOsageOttawaPaiutePakistaniPalestinianPanamanianParaguayanPennsylvania GermanPeruvianPimaPolishPortuguesePotawatomiPuebloPuerto RicanPuget Sound SalishRomanianRussianSalvadoranSamoanScandinavianScotch-IrishScottishSeminoleSenegaleseSerbianShoshoneSierra LeoneanSiouxSlavicSlovakSloveneSomaliSouth AfricanSouth AmericanSouth American IndianSoviet UnionSpaniardSpanishSpanish AmericanSpanish American IndianSri LankanSubsaharan AfricanSudaneseSwedishSwissSyrianTaiwaneseThaiTlingit-HaidaTohono O'OdhamTonganTrinidadian and TobagonianTsimshianTurkishU.S. Virgin IslanderUgandanUkrainianUruguayanUteVenezuelanVietnameseWelshWest IndianYakamaYaquiYugoslavianYumanYup'ikZimbabwean
Immigration
NonimmigrantsImmigrantsAfghanistanAfricaAlbaniaArgentinaArmeniaAsiaAustraliaAustriaBahamasBangladeshBarbadosBelarusBelgiumBelizeBoliviaBosnia and HerzegovinaBrazilBulgariaBurma/MyanmarCabo VerdeCambodiaCameroonCanadaCaribbeanCentral AmericaChileChinaColombiaCongoCosta RicaCroatiaCubaCzechoslovakiaDenmarkDominicaDominican RepublicEastern AfricaEastern AsiaEastern EuropeEcuadorEgyptEl SalvadorEnglandEritreaEthiopiaEuropeFijiFranceGermanyGhanaGreeceGrenadaGuatemalaGuyanaHaitiHondurasHong KongHungaryIndiaIndonesiaIranIraqIrelandIsraelItalyJamaicaJapanJordanKazakhstanKenyaKoreaKuwaitLaosLatin AmericaLatviaLebanonLiberiaLithuaniaMalaysiaMexicoMicronesiaMiddle AfricaMoldovaMoroccoNepalNetherlandsNicaraguaNigeriaNorth AmericaNorth MacedoniaNorthern AfricaNorthern EuropeNorwayOceaniaPakistanPanamaPeruPhilippinesPolandPortugalRomaniaRussiaSaudi ArabiaScotlandSenegalSerbiaSierra LeoneSingaporeSomaliaSouth AfricaSouth AmericaSouth Central AsiaSouth Eastern AsiaSouthern EuropeSpainSri LankaSt. Vincent and the GrenadinesSudanSwedenSwitzerlandSyriaTaiwanThailandTrinidad and TobagoTurkeyUgandaUkraineUruguayUzbekistanVenezuelaWest IndiesWestern AfricaWestern AsiaWestern EuropeYemenZaireZimbabweAzores
Immigrants from Vietnam
Race
Ancestry
AfghanAfricanAlaska NativeAlaskan AthabascanAlbanianAleutAlsatianAmericanApacheArabArapahoArgentineanArmenianAssyrian/Chaldean/SyriacAustralianAustrianBahamianBangladeshiBarbadianBasqueBelgianBelizeanBermudanBhutaneseBlackfeetBolivianBrazilianBritishBritish West IndianBulgarianBurmeseCajunCambodianCanadianCape VerdeanCarpatho RusynCelticCentral AmericanCentral American IndianCherokeeCheyenneChickasawChileanChineseChippewaChoctawColombianColvilleComancheCosta RicanCreeCreekCroatianCrowCubanCypriotCzechCzechoslovakianDanishDelawareDominicanDutchDutch West IndianEastern EuropeanEcuadorianEgyptianEnglishEstonianEthiopianEuropeanFijianFilipinoFinnishFrenchFrench American IndianFrench CanadianGermanGerman RussianGhanaianGreekGuamanian/ChamorroGuatemalanGuyaneseHaitianHmongHonduranHopiHoumaHungarianIcelanderIndian (Asian)IndonesianInupiatIranianIraqiIrishIroquoisIsraeliItalianJamaicanJapaneseJordanianKenyanKiowaKoreanLaotianLatvianLebaneseLiberianLithuanianLumbeeLuxembourgerMacedonianMalaysianMalteseMarshalleseMenomineeMexicanMexican American IndianMongolianMoroccanNative HawaiianNavajoNepaleseNew ZealanderNicaraguanNigerianNorthern EuropeanNorwegianOkinawanOsageOttawaPaiutePakistaniPalestinianPanamanianParaguayanPennsylvania GermanPeruvianPimaPolishPortuguesePotawatomiPuebloPuerto RicanPuget Sound SalishRomanianRussianSalvadoranSamoanScandinavianScotch-IrishScottishSeminoleSenegaleseSerbianShoshoneSierra LeoneanSiouxSlavicSlovakSloveneSomaliSouth AfricanSouth AmericanSouth American IndianSoviet UnionSpaniardSpanishSpanish AmericanSpanish American IndianSri LankanSubsaharan AfricanSudaneseSwedishSwissSyrianTaiwaneseThaiTlingit-HaidaTohono O'OdhamTonganTrinidadian and TobagonianTsimshianTurkishU.S. Virgin IslanderUgandanUkrainianUruguayanUteVenezuelanVietnameseWelshWest IndianYakamaYaquiYugoslavianYumanYup'ikZimbabwean
Immigration
NonimmigrantsImmigrantsAfghanistanAfricaAlbaniaArgentinaArmeniaAsiaAustraliaAustriaBahamasBangladeshBarbadosBelarusBelgiumBelizeBoliviaBosnia and HerzegovinaBrazilBulgariaBurma/MyanmarCabo VerdeCambodiaCameroonCanadaCaribbeanCentral AmericaChileChinaColombiaCongoCosta RicaCroatiaCubaCzechoslovakiaDenmarkDominicaDominican RepublicEastern AfricaEastern AsiaEastern EuropeEcuadorEgyptEl SalvadorEnglandEritreaEthiopiaEuropeFijiFranceGermanyGhanaGreeceGrenadaGuatemalaGuyanaHaitiHondurasHong KongHungaryIndiaIndonesiaIranIraqIrelandIsraelItalyJamaicaJapanJordanKazakhstanKenyaKoreaKuwaitLaosLatin AmericaLatviaLebanonLiberiaLithuaniaMalaysiaMexicoMicronesiaMiddle AfricaMoldovaMoroccoNepalNetherlandsNicaraguaNigeriaNorth AmericaNorth MacedoniaNorthern AfricaNorthern EuropeNorwayOceaniaPakistanPanamaPeruPhilippinesPolandPortugalRomaniaRussiaSaudi ArabiaScotlandSenegalSerbiaSierra LeoneSingaporeSomaliaSouth AfricaSouth AmericaSouth Central AsiaSouth Eastern AsiaSouthern EuropeSpainSri LankaSt. Vincent and the GrenadinesSudanSwedenSwitzerlandSyriaThailandTrinidad and TobagoTurkeyUgandaUkraineUruguayUzbekistanVenezuelaVietnamWest IndiesWestern AfricaWestern AsiaWestern EuropeYemenZaireZimbabweAzores
Associate's Degree
Income
Poverty
Unemployment
Labor Participation
Family Structure
Vehicle Availability
Education Level
Disability

Associate's Degree Comparison

Immigrants from Taiwan

Immigrants from Vietnam

Exceptional
Fair
58.4%
ASSOCIATE'S DEGREE
100.0/ 100
METRIC RATING
4th/ 347
METRIC RANK
45.2%
ASSOCIATE'S DEGREE
20.8/ 100
METRIC RATING
201st/ 347
METRIC RANK

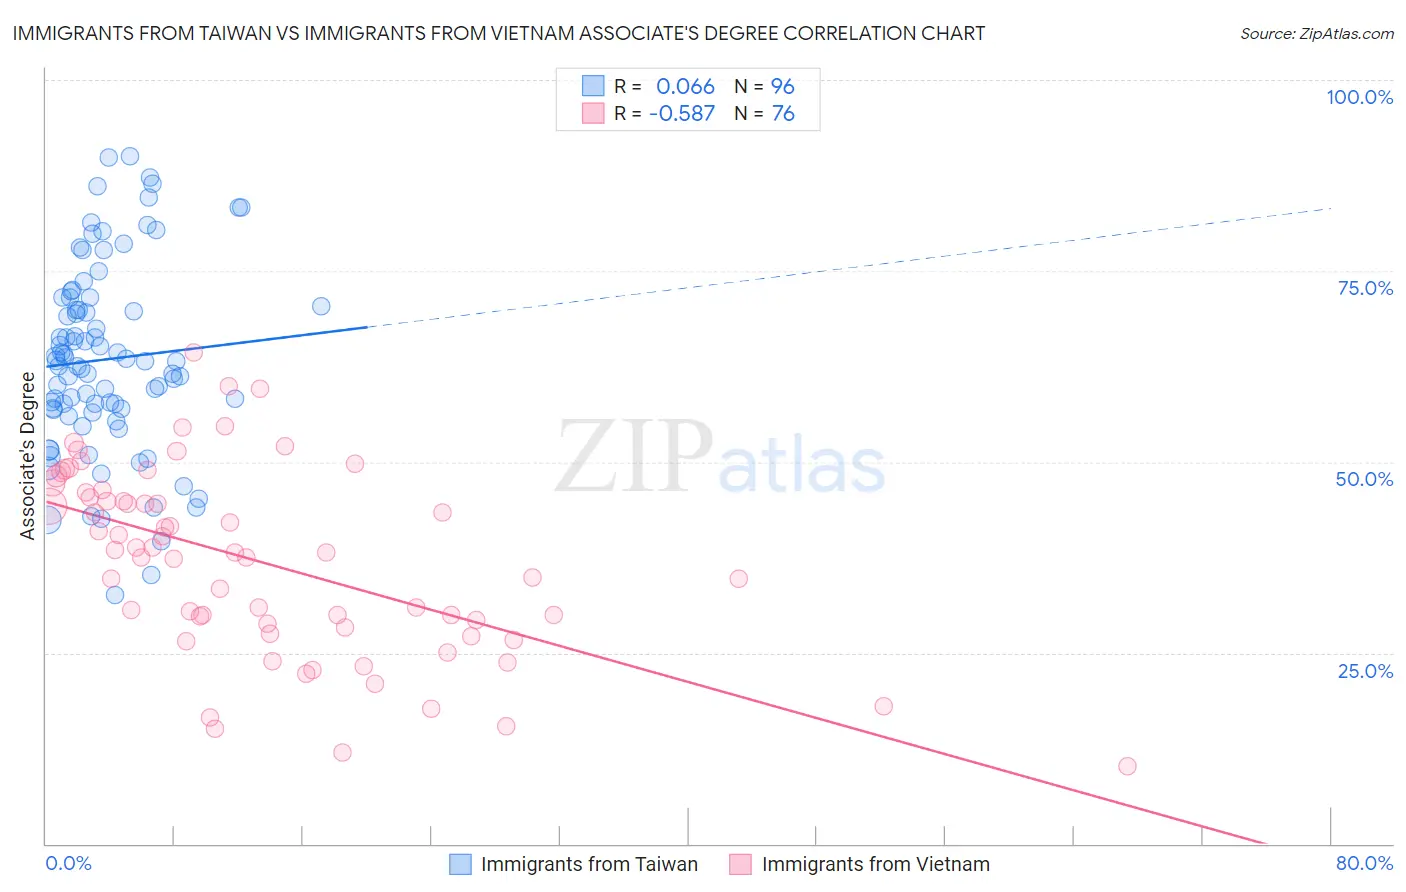
Immigrants from Taiwan vs Immigrants from Vietnam Associate's Degree Correlation Chart

The statistical analysis conducted on geographies consisting of 298,276,858 people shows a slight positive correlation between the proportion of Immigrants from Taiwan and percentage of population with at least associate's degree education in the United States with a correlation coefficient (R) of 0.066 and weighted average of 58.4%. Similarly, the statistical analysis conducted on geographies consisting of 404,825,690 people shows a substantial negative correlation between the proportion of Immigrants from Vietnam and percentage of population with at least associate's degree education in the United States with a correlation coefficient (R) of -0.587 and weighted average of 45.2%, a difference of 29.2%.
Immigrants from Taiwan vs Immigrants from Vietnam Associate's Degree

Associate's Degree Correlation Summary

MeasurementImmigrants from TaiwanImmigrants from Vietnam
Minimum32.5%10.2%
Maximum89.9%64.3%
Range57.4%54.0%
Mean63.4%36.9%
Median63.2%38.1%
Interquartile 25% (IQ1)56.9%28.6%
Interquartile 75% (IQ3)70.9%45.7%
Interquartile Range (IQR)14.0%17.1%
Standard Deviation (Sample)12.4%12.1%
Standard Deviation (Population)12.4%12.0%

Similar Demographics by Associate's Degree

Demographics Similar to Immigrants from Taiwan by Associate's Degree

In terms of associate's degree, the demographic groups most similar to Immigrants from Taiwan are Immigrants from India (58.5%, a difference of 0.25%), Iranian (58.2%, a difference of 0.41%), Immigrants from Singapore (58.9%, a difference of 0.91%), Okinawan (57.7%, a difference of 1.2%), and Immigrants from Iran (57.7%, a difference of 1.3%).
DemographicsRating | RankAssociate's Degree
Filipinos
100.0
/100
|
#1
Exceptional
59.8%
Immigrants | Singapore
100.0
/100
|
#2
Exceptional
58.9%
Immigrants | India
100.0
/100
|
#3
Exceptional
58.5%
Immigrants | Taiwan
100.0
/100
|
#4
Exceptional
58.4%
Iranians
100.0
/100
|
#5
Exceptional
58.2%
Okinawans
100.0
/100
|
#6
Exceptional
57.7%
Immigrants | Iran
100.0
/100
|
#7
Exceptional
57.7%
Thais
100.0
/100
|
#8
Exceptional
57.4%
Immigrants | Israel
100.0
/100
|
#9
Exceptional
56.8%
Cypriots
100.0
/100
|
#10
Exceptional
56.4%
Immigrants | Australia
100.0
/100
|
#11
Exceptional
55.8%
Immigrants | South Central Asia
100.0
/100
|
#12
Exceptional
55.7%
Immigrants | China
100.0
/100
|
#13
Exceptional
55.5%
Immigrants | Hong Kong
100.0
/100
|
#14
Exceptional
55.4%
Immigrants | Eastern Asia
100.0
/100
|
#15
Exceptional
55.4%

Demographics Similar to Immigrants from Vietnam by Associate's Degree

In terms of associate's degree, the demographic groups most similar to Immigrants from Vietnam are Senegalese (45.2%, a difference of 0.030%), Immigrants from Senegal (45.2%, a difference of 0.040%), Spaniard (45.2%, a difference of 0.050%), Immigrants from Bangladesh (45.2%, a difference of 0.060%), and Immigrants from South Eastern Asia (45.2%, a difference of 0.070%).
DemographicsRating | RankAssociate's Degree
Immigrants | Peru
27.6
/100
|
#194
Fair
45.5%
Germans
26.5
/100
|
#195
Fair
45.5%
French
25.6
/100
|
#196
Fair
45.4%
Scotch-Irish
22.3
/100
|
#197
Fair
45.3%
Immigrants | Bangladesh
21.3
/100
|
#198
Fair
45.2%
Immigrants | Senegal
21.2
/100
|
#199
Fair
45.2%
Senegalese
21.1
/100
|
#200
Fair
45.2%
Immigrants | Vietnam
20.8
/100
|
#201
Fair
45.2%
Spaniards
20.4
/100
|
#202
Fair
45.2%
Immigrants | South Eastern Asia
20.2
/100
|
#203
Fair
45.2%
Nigerians
19.1
/100
|
#204
Poor
45.1%
Immigrants | Thailand
18.9
/100
|
#205
Poor
45.1%
German Russians
18.9
/100
|
#206
Poor
45.1%
Panamanians
18.4
/100
|
#207
Poor
45.1%
Dutch
17.6
/100
|
#208
Poor
45.0%