Czech vs Immigrants from Vietnam Disability
COMPARE
Czech
Immigrants from Vietnam
Disability
Disability Comparison
Czechs
Immigrants from Vietnam
12.0%
DISABILITY
7.9/ 100
METRIC RATING
210th/ 347
METRIC RANK
11.0%
DISABILITY
99.4/ 100
METRIC RATING
75th/ 347
METRIC RANK
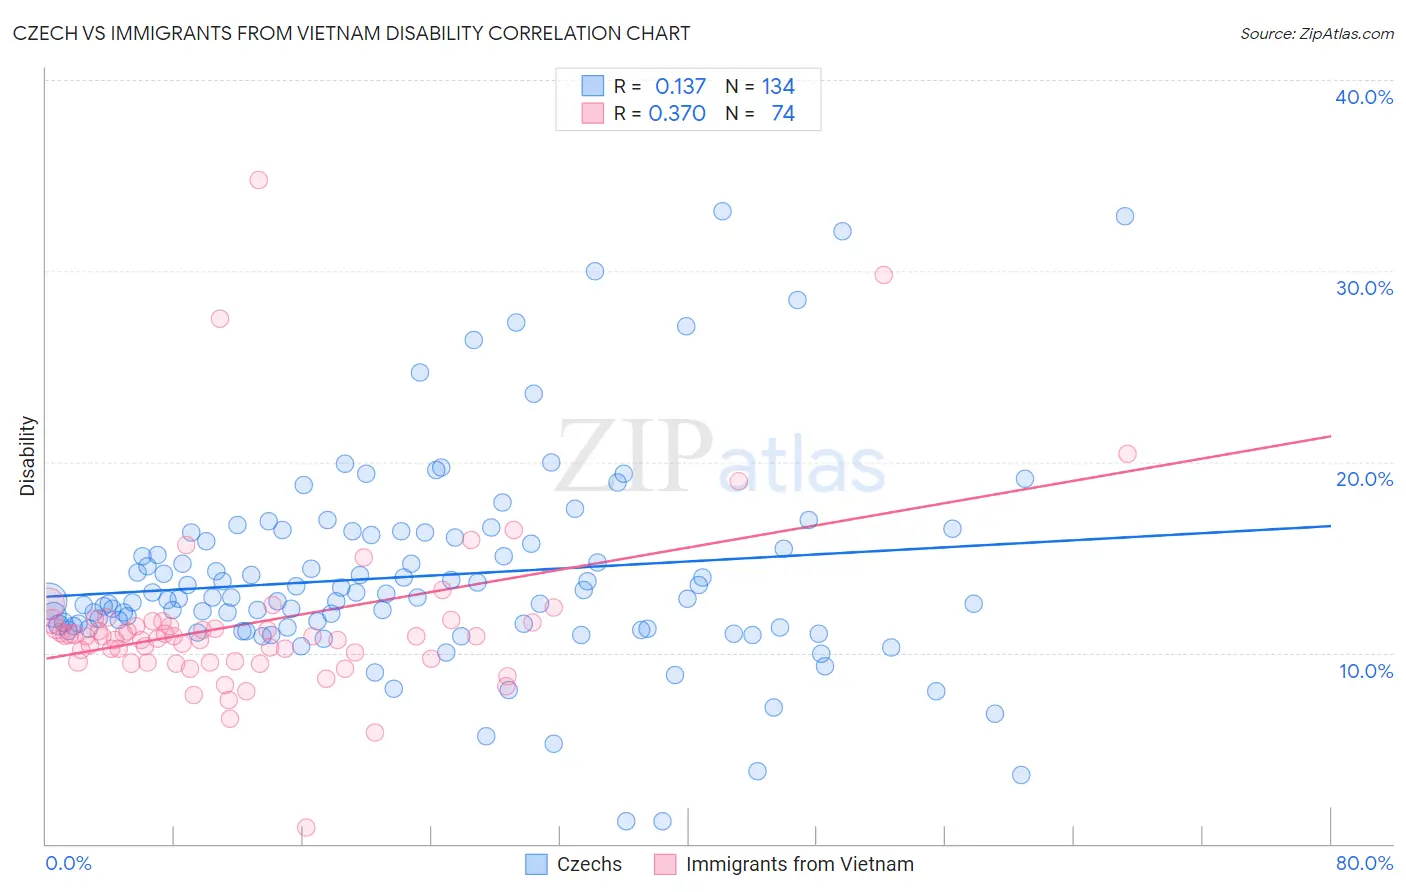
Czech vs Immigrants from Vietnam Disability Correlation Chart
The statistical analysis conducted on geographies consisting of 484,761,061 people shows a poor positive correlation between the proportion of Czechs and percentage of population with a disability in the United States with a correlation coefficient (R) of 0.137 and weighted average of 12.0%. Similarly, the statistical analysis conducted on geographies consisting of 404,777,334 people shows a mild positive correlation between the proportion of Immigrants from Vietnam and percentage of population with a disability in the United States with a correlation coefficient (R) of 0.370 and weighted average of 11.0%, a difference of 8.8%.
Disability Correlation Summary
| Measurement | Czech | Immigrants from Vietnam |
| Minimum | 1.2% | 0.87% |
| Maximum | 33.1% | 34.7% |
| Range | 31.9% | 33.9% |
| Mean | 14.0% | 11.6% |
| Median | 12.9% | 10.9% |
| Interquartile 25% (IQ1) | 11.3% | 9.6% |
| Interquartile 75% (IQ3) | 16.0% | 11.6% |
| Interquartile Range (IQR) | 4.7% | 2.0% |
| Standard Deviation (Sample) | 5.4% | 4.8% |
| Standard Deviation (Population) | 5.4% | 4.7% |
Similar Demographics by Disability
Demographics Similar to Czechs by Disability
In terms of disability, the demographic groups most similar to Czechs are Immigrants from Cambodia (12.0%, a difference of 0.080%), Austrian (12.0%, a difference of 0.11%), Immigrants from Iraq (12.0%, a difference of 0.11%), Danish (12.0%, a difference of 0.13%), and Immigrants from Somalia (12.0%, a difference of 0.16%).
| Demographics | Rating | Rank | Disability |
| British West Indians | 11.5 /100 | #203 | Poor 12.0% |
| Mexican American Indians | 11.4 /100 | #204 | Poor 12.0% |
| Immigrants | Western Europe | 10.1 /100 | #205 | Poor 12.0% |
| Immigrants | Senegal | 9.4 /100 | #206 | Tragic 12.0% |
| Immigrants | Thailand | 9.3 /100 | #207 | Tragic 12.0% |
| Immigrants | Caribbean | 9.1 /100 | #208 | Tragic 12.0% |
| Danes | 8.7 /100 | #209 | Tragic 12.0% |
| Czechs | 7.9 /100 | #210 | Tragic 12.0% |
| Immigrants | Cambodia | 7.3 /100 | #211 | Tragic 12.0% |
| Austrians | 7.2 /100 | #212 | Tragic 12.0% |
| Immigrants | Iraq | 7.1 /100 | #213 | Tragic 12.0% |
| Immigrants | Somalia | 6.8 /100 | #214 | Tragic 12.0% |
| Immigrants | Canada | 6.1 /100 | #215 | Tragic 12.1% |
| Panamanians | 5.4 /100 | #216 | Tragic 12.1% |
| Immigrants | North America | 5.3 /100 | #217 | Tragic 12.1% |
Demographics Similar to Immigrants from Vietnam by Disability
In terms of disability, the demographic groups most similar to Immigrants from Vietnam are Immigrants from Serbia (11.0%, a difference of 0.020%), Sierra Leonean (11.0%, a difference of 0.030%), Immigrants from Belgium (11.0%, a difference of 0.030%), Immigrants from Bangladesh (11.0%, a difference of 0.040%), and Immigrants from Chile (11.0%, a difference of 0.070%).
| Demographics | Rating | Rank | Disability |
| Immigrants | Afghanistan | 99.6 /100 | #68 | Exceptional 11.0% |
| Sri Lankans | 99.5 /100 | #69 | Exceptional 11.0% |
| Immigrants | France | 99.4 /100 | #70 | Exceptional 11.0% |
| Immigrants | Lebanon | 99.4 /100 | #71 | Exceptional 11.0% |
| Immigrants | Chile | 99.4 /100 | #72 | Exceptional 11.0% |
| Immigrants | Bangladesh | 99.4 /100 | #73 | Exceptional 11.0% |
| Immigrants | Serbia | 99.4 /100 | #74 | Exceptional 11.0% |
| Immigrants | Vietnam | 99.4 /100 | #75 | Exceptional 11.0% |
| Sierra Leoneans | 99.3 /100 | #76 | Exceptional 11.0% |
| Immigrants | Belgium | 99.3 /100 | #77 | Exceptional 11.0% |
| Immigrants | Cameroon | 99.3 /100 | #78 | Exceptional 11.1% |
| Immigrants | Jordan | 99.3 /100 | #79 | Exceptional 11.1% |
| Immigrants | Ireland | 99.3 /100 | #80 | Exceptional 11.1% |
| Immigrants | Poland | 99.1 /100 | #81 | Exceptional 11.1% |
| Chileans | 99.1 /100 | #82 | Exceptional 11.1% |