Czech vs Immigrants from Belarus 2nd Grade
COMPARE
Czech
Immigrants from Belarus
2nd Grade
2nd Grade Comparison
Czechs
Immigrants from Belarus
98.5%
2ND GRADE
100.0/ 100
METRIC RATING
31st/ 347
METRIC RANK
97.8%
2ND GRADE
41.5/ 100
METRIC RATING
184th/ 347
METRIC RANK
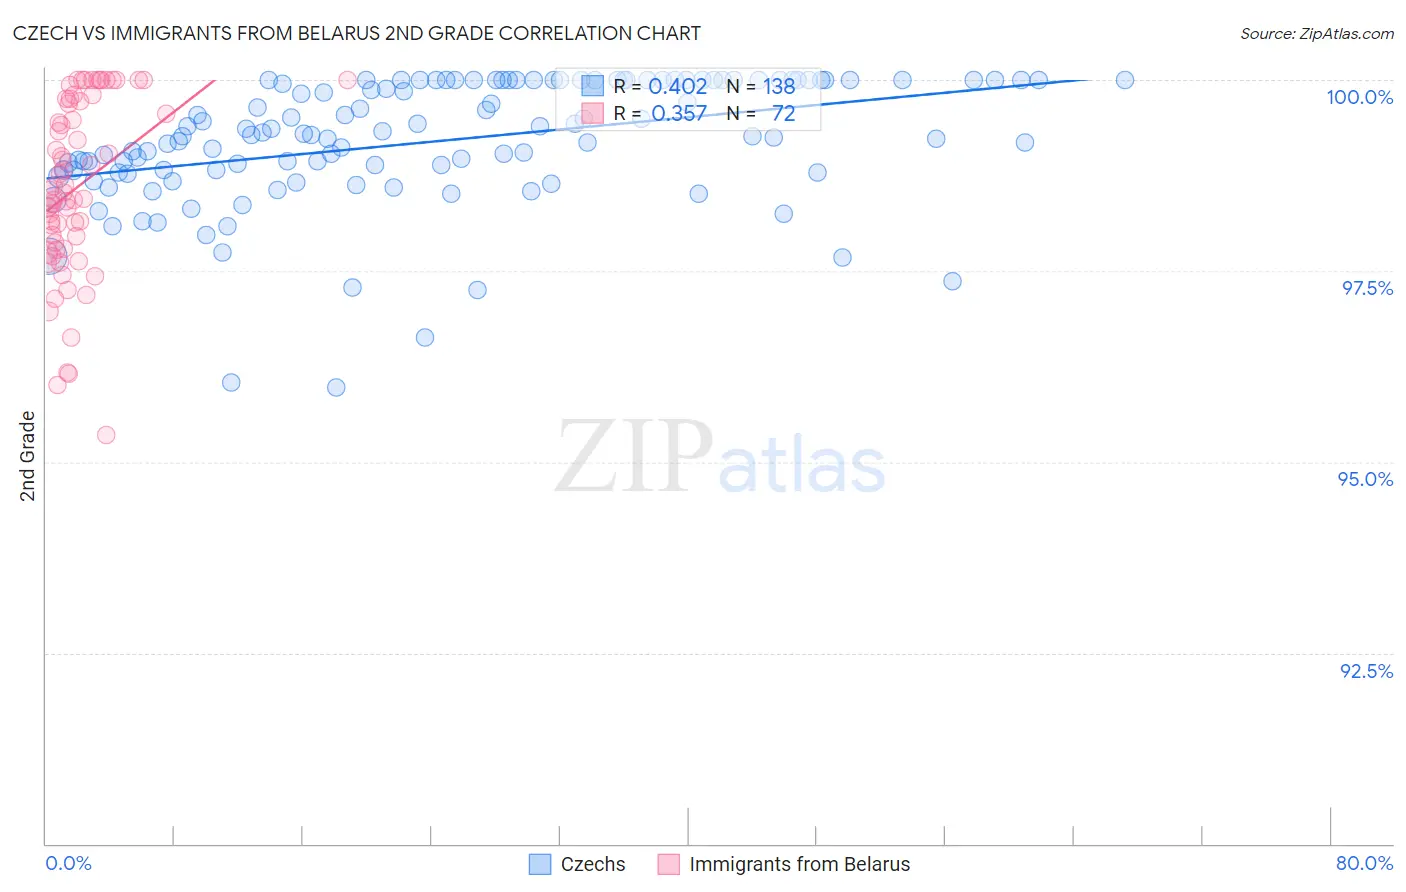
Czech vs Immigrants from Belarus 2nd Grade Correlation Chart
The statistical analysis conducted on geographies consisting of 484,813,102 people shows a moderate positive correlation between the proportion of Czechs and percentage of population with at least 2nd grade education in the United States with a correlation coefficient (R) of 0.402 and weighted average of 98.5%. Similarly, the statistical analysis conducted on geographies consisting of 149,993,317 people shows a mild positive correlation between the proportion of Immigrants from Belarus and percentage of population with at least 2nd grade education in the United States with a correlation coefficient (R) of 0.357 and weighted average of 97.8%, a difference of 0.68%.
2nd Grade Correlation Summary
| Measurement | Czech | Immigrants from Belarus |
| Minimum | 96.0% | 95.4% |
| Maximum | 100.0% | 100.0% |
| Range | 4.0% | 4.6% |
| Mean | 99.2% | 98.6% |
| Median | 99.3% | 98.5% |
| Interquartile 25% (IQ1) | 98.8% | 97.8% |
| Interquartile 75% (IQ3) | 100.0% | 99.7% |
| Interquartile Range (IQR) | 1.2% | 1.9% |
| Standard Deviation (Sample) | 0.82% | 1.1% |
| Standard Deviation (Population) | 0.82% | 1.1% |
Similar Demographics by 2nd Grade
Demographics Similar to Czechs by 2nd Grade
In terms of 2nd grade, the demographic groups most similar to Czechs are European (98.5%, a difference of 0.0%), French Canadian (98.5%, a difference of 0.0%), Arapaho (98.5%, a difference of 0.010%), French (98.5%, a difference of 0.010%), and Scandinavian (98.5%, a difference of 0.010%).
| Demographics | Rating | Rank | 2nd Grade |
| Pennsylvania Germans | 100.0 /100 | #24 | Exceptional 98.5% |
| Scotch-Irish | 100.0 /100 | #25 | Exceptional 98.5% |
| Welsh | 100.0 /100 | #26 | Exceptional 98.5% |
| Croatians | 100.0 /100 | #27 | Exceptional 98.5% |
| Arapaho | 100.0 /100 | #28 | Exceptional 98.5% |
| French | 100.0 /100 | #29 | Exceptional 98.5% |
| Europeans | 100.0 /100 | #30 | Exceptional 98.5% |
| Czechs | 100.0 /100 | #31 | Exceptional 98.5% |
| French Canadians | 100.0 /100 | #32 | Exceptional 98.5% |
| Scandinavians | 100.0 /100 | #33 | Exceptional 98.5% |
| Chinese | 100.0 /100 | #34 | Exceptional 98.5% |
| Swiss | 100.0 /100 | #35 | Exceptional 98.5% |
| British | 100.0 /100 | #36 | Exceptional 98.5% |
| Italians | 99.9 /100 | #37 | Exceptional 98.4% |
| Latvians | 99.9 /100 | #38 | Exceptional 98.4% |
Demographics Similar to Immigrants from Belarus by 2nd Grade
In terms of 2nd grade, the demographic groups most similar to Immigrants from Belarus are Portuguese (97.8%, a difference of 0.0%), Immigrants from Poland (97.8%, a difference of 0.0%), Immigrants from Argentina (97.8%, a difference of 0.0%), Immigrants from Venezuela (97.9%, a difference of 0.010%), and Native/Alaskan (97.9%, a difference of 0.010%).
| Demographics | Rating | Rank | 2nd Grade |
| Immigrants | Brazil | 46.6 /100 | #177 | Average 97.9% |
| Argentineans | 46.3 /100 | #178 | Average 97.9% |
| Immigrants | Venezuela | 46.1 /100 | #179 | Average 97.9% |
| Natives/Alaskans | 44.3 /100 | #180 | Average 97.9% |
| Egyptians | 44.3 /100 | #181 | Average 97.9% |
| Portuguese | 42.4 /100 | #182 | Average 97.8% |
| Immigrants | Poland | 42.2 /100 | #183 | Average 97.8% |
| Immigrants | Belarus | 41.5 /100 | #184 | Average 97.8% |
| Immigrants | Argentina | 40.6 /100 | #185 | Average 97.8% |
| Arabs | 36.9 /100 | #186 | Fair 97.8% |
| Pakistanis | 36.1 /100 | #187 | Fair 97.8% |
| Immigrants | Kazakhstan | 35.6 /100 | #188 | Fair 97.8% |
| Panamanians | 33.5 /100 | #189 | Fair 97.8% |
| Immigrants | Taiwan | 31.8 /100 | #190 | Fair 97.8% |
| Paraguayans | 30.8 /100 | #191 | Fair 97.8% |