Czech vs Estonian 2nd Grade
COMPARE
Czech
Estonian
2nd Grade
2nd Grade Comparison
Czechs
Estonians
98.5%
2ND GRADE
100.0/ 100
METRIC RATING
31st/ 347
METRIC RANK
98.4%
2ND GRADE
99.8/ 100
METRIC RATING
51st/ 347
METRIC RANK
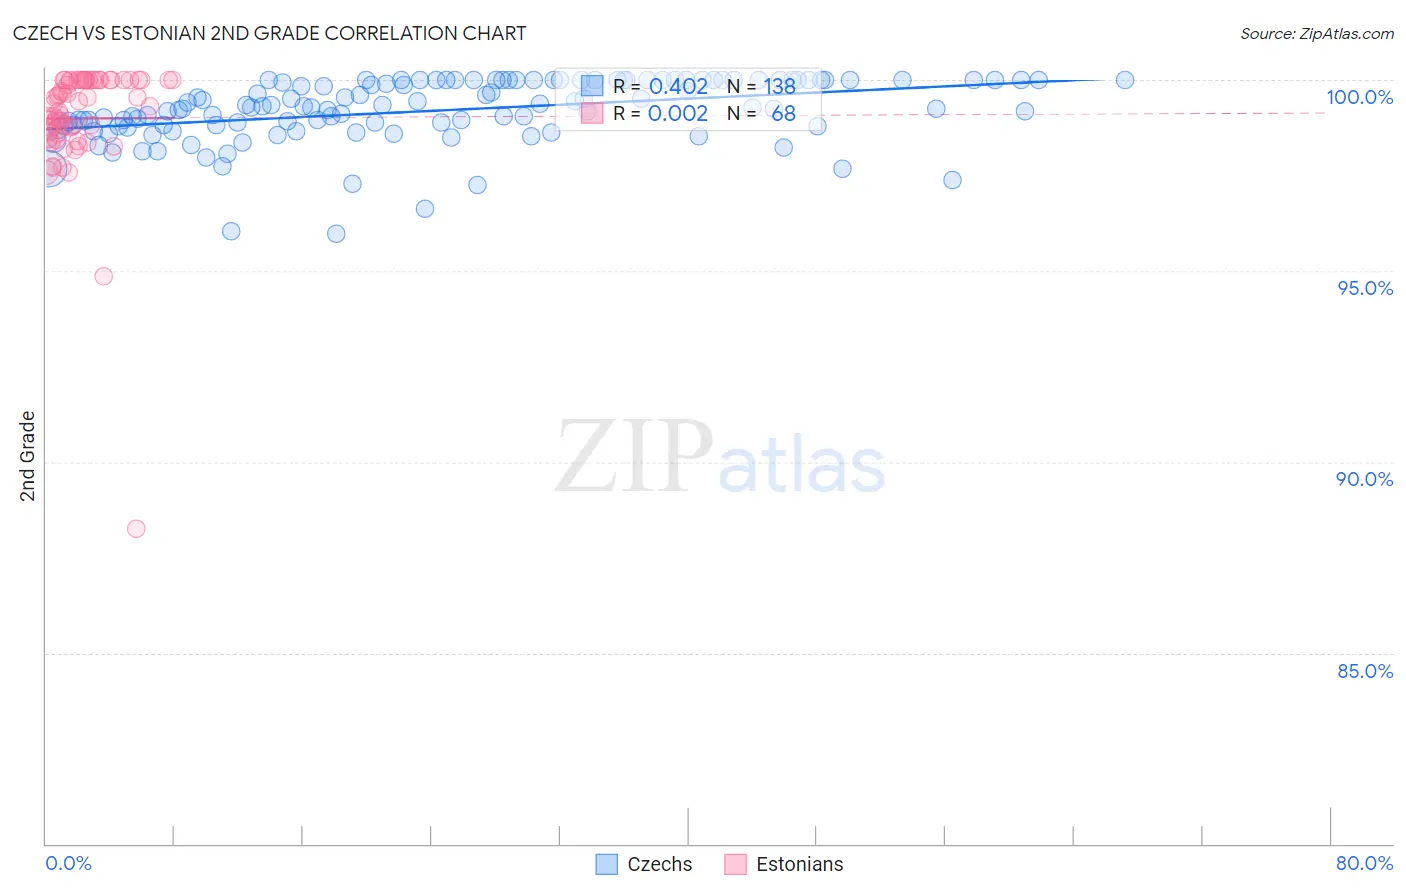
Czech vs Estonian 2nd Grade Correlation Chart
The statistical analysis conducted on geographies consisting of 484,813,102 people shows a moderate positive correlation between the proportion of Czechs and percentage of population with at least 2nd grade education in the United States with a correlation coefficient (R) of 0.402 and weighted average of 98.5%. Similarly, the statistical analysis conducted on geographies consisting of 123,528,404 people shows no correlation between the proportion of Estonians and percentage of population with at least 2nd grade education in the United States with a correlation coefficient (R) of 0.002 and weighted average of 98.4%, a difference of 0.15%.
2nd Grade Correlation Summary
| Measurement | Czech | Estonian |
| Minimum | 96.0% | 88.3% |
| Maximum | 100.0% | 100.0% |
| Range | 4.0% | 11.7% |
| Mean | 99.2% | 99.0% |
| Median | 99.3% | 99.3% |
| Interquartile 25% (IQ1) | 98.8% | 98.5% |
| Interquartile 75% (IQ3) | 100.0% | 100.0% |
| Interquartile Range (IQR) | 1.2% | 1.5% |
| Standard Deviation (Sample) | 0.82% | 1.6% |
| Standard Deviation (Population) | 0.82% | 1.6% |
Demographics Similar to Czechs and Estonians by 2nd Grade
In terms of 2nd grade, the demographic groups most similar to Czechs are French Canadian (98.5%, a difference of 0.0%), Scandinavian (98.5%, a difference of 0.010%), Chinese (98.5%, a difference of 0.030%), Swiss (98.5%, a difference of 0.030%), and British (98.5%, a difference of 0.050%). Similarly, the demographic groups most similar to Estonians are Celtic (98.4%, a difference of 0.0%), White/Caucasian (98.4%, a difference of 0.0%), Czechoslovakian (98.4%, a difference of 0.010%), Ottawa (98.4%, a difference of 0.020%), and Hungarian (98.4%, a difference of 0.030%).
| Demographics | Rating | Rank | 2nd Grade |
| Czechs | 100.0 /100 | #31 | Exceptional 98.5% |
| French Canadians | 100.0 /100 | #32 | Exceptional 98.5% |
| Scandinavians | 100.0 /100 | #33 | Exceptional 98.5% |
| Chinese | 100.0 /100 | #34 | Exceptional 98.5% |
| Swiss | 100.0 /100 | #35 | Exceptional 98.5% |
| British | 100.0 /100 | #36 | Exceptional 98.5% |
| Italians | 99.9 /100 | #37 | Exceptional 98.4% |
| Latvians | 99.9 /100 | #38 | Exceptional 98.4% |
| Chippewa | 99.9 /100 | #39 | Exceptional 98.4% |
| Luxembourgers | 99.9 /100 | #40 | Exceptional 98.4% |
| Eastern Europeans | 99.9 /100 | #41 | Exceptional 98.4% |
| Native Hawaiians | 99.9 /100 | #42 | Exceptional 98.4% |
| Belgians | 99.9 /100 | #43 | Exceptional 98.4% |
| Northern Europeans | 99.9 /100 | #44 | Exceptional 98.4% |
| Hungarians | 99.9 /100 | #45 | Exceptional 98.4% |
| Lumbee | 99.9 /100 | #46 | Exceptional 98.4% |
| Ottawa | 99.9 /100 | #47 | Exceptional 98.4% |
| Czechoslovakians | 99.9 /100 | #48 | Exceptional 98.4% |
| Celtics | 99.8 /100 | #49 | Exceptional 98.4% |
| Whites/Caucasians | 99.8 /100 | #50 | Exceptional 98.4% |
| Estonians | 99.8 /100 | #51 | Exceptional 98.4% |