Czech vs Immigrants from Switzerland College, 1 year or more
COMPARE
Czech
Immigrants from Switzerland
College, 1 year or more
College, 1 year or more Comparison
Czechs
Immigrants from Switzerland
60.6%
COLLEGE, 1 YEAR OR MORE
81.9/ 100
METRIC RATING
144th/ 347
METRIC RANK
66.5%
COLLEGE, 1 YEAR OR MORE
100.0/ 100
METRIC RATING
19th/ 347
METRIC RANK
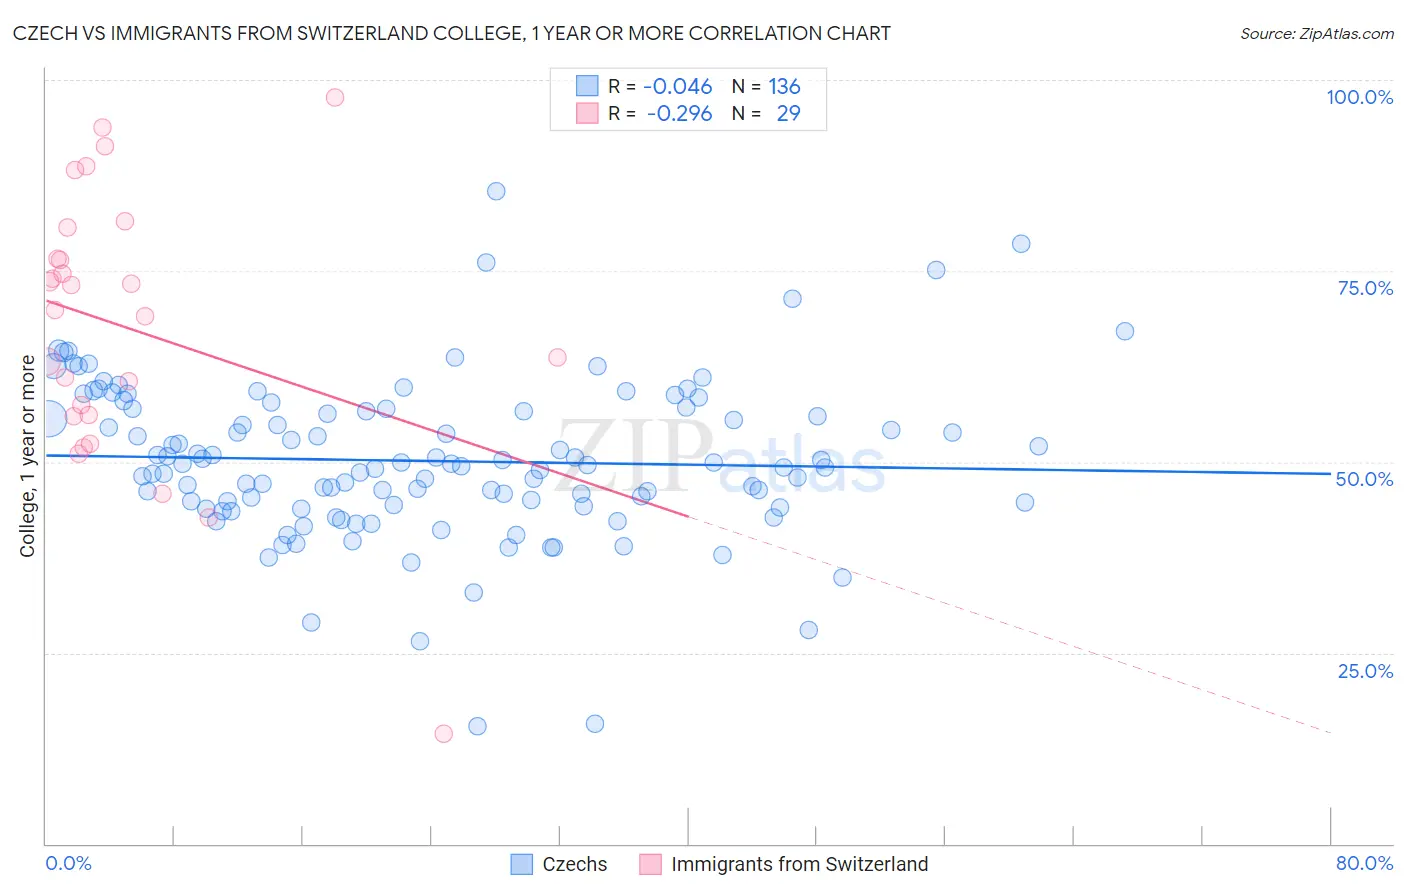
Czech vs Immigrants from Switzerland College, 1 year or more Correlation Chart
The statistical analysis conducted on geographies consisting of 484,810,404 people shows no correlation between the proportion of Czechs and percentage of population with at least college, 1 year or more education in the United States with a correlation coefficient (R) of -0.046 and weighted average of 60.6%. Similarly, the statistical analysis conducted on geographies consisting of 148,083,488 people shows a weak negative correlation between the proportion of Immigrants from Switzerland and percentage of population with at least college, 1 year or more education in the United States with a correlation coefficient (R) of -0.296 and weighted average of 66.5%, a difference of 9.8%.
College, 1 year or more Correlation Summary
| Measurement | Czech | Immigrants from Switzerland |
| Minimum | 15.4% | 14.4% |
| Maximum | 85.4% | 97.7% |
| Range | 70.0% | 83.3% |
| Mean | 50.1% | 67.6% |
| Median | 49.5% | 69.8% |
| Interquartile 25% (IQ1) | 44.3% | 56.1% |
| Interquartile 75% (IQ3) | 56.8% | 78.6% |
| Interquartile Range (IQR) | 12.5% | 22.5% |
| Standard Deviation (Sample) | 10.5% | 17.8% |
| Standard Deviation (Population) | 10.4% | 17.5% |
Similar Demographics by College, 1 year or more
Demographics Similar to Czechs by College, 1 year or more
In terms of college, 1 year or more, the demographic groups most similar to Czechs are Slavic (60.6%, a difference of 0.070%), Polish (60.7%, a difference of 0.080%), Canadian (60.6%, a difference of 0.080%), Immigrants from Afghanistan (60.7%, a difference of 0.11%), and Iraqi (60.7%, a difference of 0.13%).
| Demographics | Rating | Rank | College, 1 year or more |
| Slovenes | 86.5 /100 | #137 | Excellent 60.9% |
| Taiwanese | 84.3 /100 | #138 | Excellent 60.7% |
| Immigrants | Eritrea | 84.3 /100 | #139 | Excellent 60.7% |
| Iraqis | 83.3 /100 | #140 | Excellent 60.7% |
| Immigrants | Afghanistan | 83.1 /100 | #141 | Excellent 60.7% |
| Poles | 82.8 /100 | #142 | Excellent 60.7% |
| Canadians | 82.7 /100 | #143 | Excellent 60.6% |
| Czechs | 81.9 /100 | #144 | Excellent 60.6% |
| Slavs | 81.1 /100 | #145 | Excellent 60.6% |
| Scottish | 80.2 /100 | #146 | Excellent 60.5% |
| Immigrants | Kenya | 79.1 /100 | #147 | Good 60.5% |
| Kenyans | 79.0 /100 | #148 | Good 60.5% |
| Brazilians | 79.0 /100 | #149 | Good 60.5% |
| Immigrants | Sudan | 77.8 /100 | #150 | Good 60.4% |
| Albanians | 77.8 /100 | #151 | Good 60.4% |
Demographics Similar to Immigrants from Switzerland by College, 1 year or more
In terms of college, 1 year or more, the demographic groups most similar to Immigrants from Switzerland are Immigrants from Korea (66.5%, a difference of 0.040%), Eastern European (66.6%, a difference of 0.050%), Immigrants from Hong Kong (66.4%, a difference of 0.11%), Immigrants from Eastern Asia (66.6%, a difference of 0.12%), and Soviet Union (66.4%, a difference of 0.17%).
| Demographics | Rating | Rank | College, 1 year or more |
| Cypriots | 100.0 /100 | #12 | Exceptional 67.0% |
| Immigrants | Sweden | 100.0 /100 | #13 | Exceptional 66.8% |
| Burmese | 100.0 /100 | #14 | Exceptional 66.7% |
| Cambodians | 100.0 /100 | #15 | Exceptional 66.7% |
| Immigrants | Japan | 100.0 /100 | #16 | Exceptional 66.7% |
| Immigrants | Eastern Asia | 100.0 /100 | #17 | Exceptional 66.6% |
| Eastern Europeans | 100.0 /100 | #18 | Exceptional 66.6% |
| Immigrants | Switzerland | 100.0 /100 | #19 | Exceptional 66.5% |
| Immigrants | Korea | 100.0 /100 | #20 | Exceptional 66.5% |
| Immigrants | Hong Kong | 100.0 /100 | #21 | Exceptional 66.4% |
| Soviet Union | 100.0 /100 | #22 | Exceptional 66.4% |
| Immigrants | China | 100.0 /100 | #23 | Exceptional 66.4% |
| Immigrants | Belgium | 100.0 /100 | #24 | Exceptional 66.3% |
| Indians (Asian) | 100.0 /100 | #25 | Exceptional 66.1% |
| Latvians | 100.0 /100 | #26 | Exceptional 66.1% |