Czechoslovakian vs Colombian 9th Grade
COMPARE
Czechoslovakian
Colombian
9th Grade
9th Grade Comparison
Czechoslovakians
Colombians
96.1%
9TH GRADE
99.9/ 100
METRIC RATING
41st/ 347
METRIC RANK
94.0%
9TH GRADE
0.8/ 100
METRIC RATING
253rd/ 347
METRIC RANK
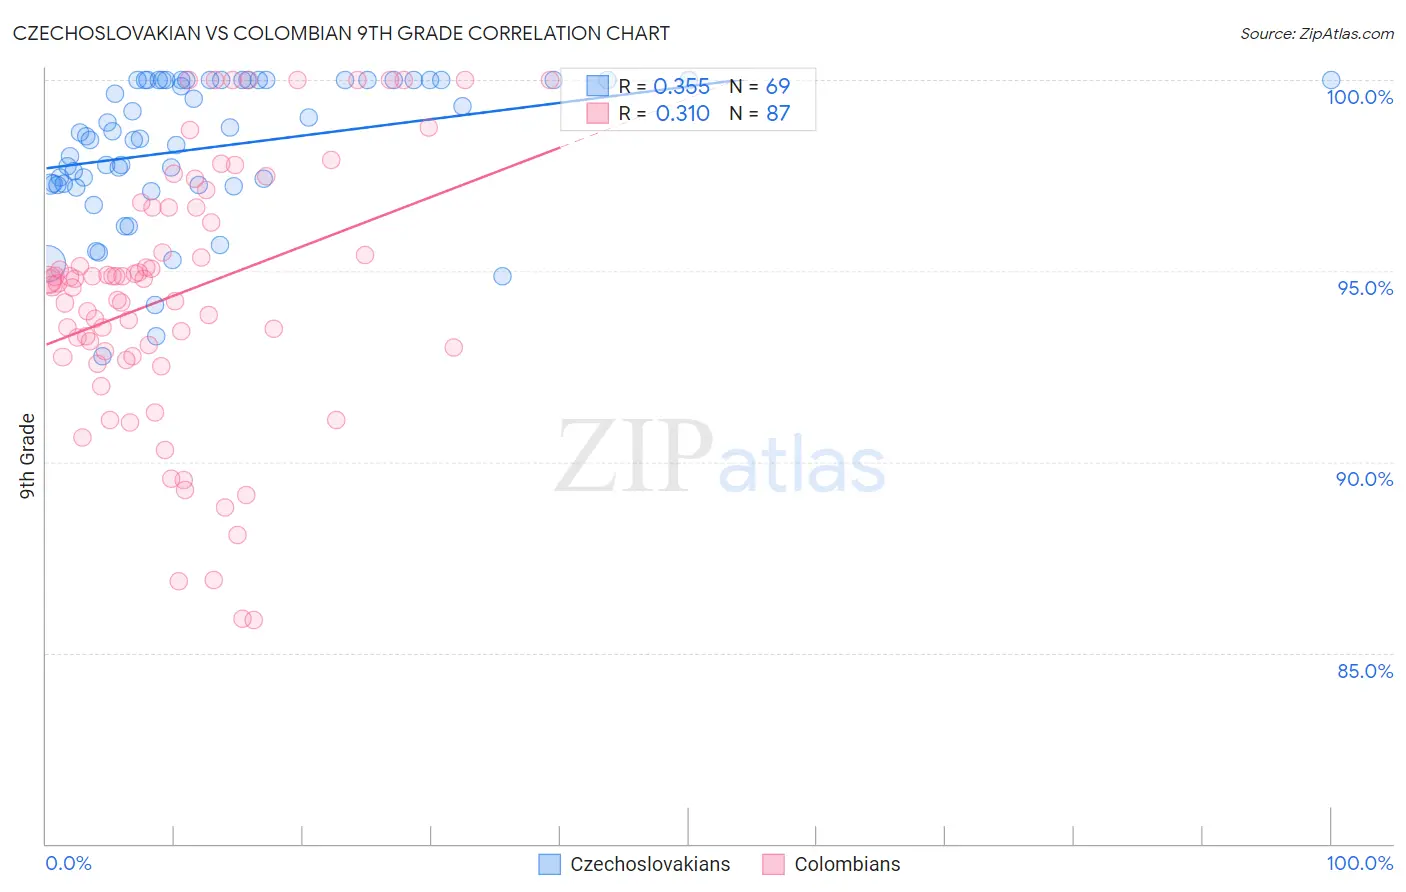
Czechoslovakian vs Colombian 9th Grade Correlation Chart
The statistical analysis conducted on geographies consisting of 368,668,876 people shows a mild positive correlation between the proportion of Czechoslovakians and percentage of population with at least 9th grade education in the United States with a correlation coefficient (R) of 0.355 and weighted average of 96.1%. Similarly, the statistical analysis conducted on geographies consisting of 419,655,116 people shows a mild positive correlation between the proportion of Colombians and percentage of population with at least 9th grade education in the United States with a correlation coefficient (R) of 0.310 and weighted average of 94.0%, a difference of 2.2%.
9th Grade Correlation Summary
| Measurement | Czechoslovakian | Colombian |
| Minimum | 92.8% | 85.8% |
| Maximum | 100.0% | 100.0% |
| Range | 7.2% | 14.2% |
| Mean | 98.2% | 94.4% |
| Median | 98.5% | 94.7% |
| Interquartile 25% (IQ1) | 97.3% | 92.8% |
| Interquartile 75% (IQ3) | 100.0% | 96.7% |
| Interquartile Range (IQR) | 2.7% | 3.9% |
| Standard Deviation (Sample) | 1.8% | 3.4% |
| Standard Deviation (Population) | 1.8% | 3.4% |
Similar Demographics by 9th Grade
Demographics Similar to Czechoslovakians by 9th Grade
In terms of 9th grade, the demographic groups most similar to Czechoslovakians are Chippewa (96.1%, a difference of 0.0%), Slavic (96.1%, a difference of 0.010%), Iranian (96.1%, a difference of 0.010%), Ottawa (96.1%, a difference of 0.030%), and Alaska Native (96.1%, a difference of 0.030%).
| Demographics | Rating | Rank | 9th Grade |
| Hungarians | 100.0 /100 | #34 | Exceptional 96.2% |
| Bulgarians | 99.9 /100 | #35 | Exceptional 96.2% |
| Northern Europeans | 99.9 /100 | #36 | Exceptional 96.2% |
| Estonians | 99.9 /100 | #37 | Exceptional 96.1% |
| Immigrants | Scotland | 99.9 /100 | #38 | Exceptional 96.1% |
| Ottawa | 99.9 /100 | #39 | Exceptional 96.1% |
| Slavs | 99.9 /100 | #40 | Exceptional 96.1% |
| Czechoslovakians | 99.9 /100 | #41 | Exceptional 96.1% |
| Chippewa | 99.9 /100 | #42 | Exceptional 96.1% |
| Iranians | 99.9 /100 | #43 | Exceptional 96.1% |
| Alaska Natives | 99.9 /100 | #44 | Exceptional 96.1% |
| Crow | 99.9 /100 | #45 | Exceptional 96.1% |
| Immigrants | India | 99.9 /100 | #46 | Exceptional 96.1% |
| Russians | 99.9 /100 | #47 | Exceptional 96.0% |
| Australians | 99.9 /100 | #48 | Exceptional 96.0% |
Demographics Similar to Colombians by 9th Grade
In terms of 9th grade, the demographic groups most similar to Colombians are Immigrants from Senegal (94.1%, a difference of 0.020%), Jamaican (94.1%, a difference of 0.030%), U.S. Virgin Islander (94.0%, a difference of 0.030%), Immigrants from Nigeria (94.0%, a difference of 0.070%), and Uruguayan (94.1%, a difference of 0.080%).
| Demographics | Rating | Rank | 9th Grade |
| Senegalese | 1.9 /100 | #246 | Tragic 94.2% |
| Afghans | 1.8 /100 | #247 | Tragic 94.2% |
| Immigrants | Somalia | 1.4 /100 | #248 | Tragic 94.1% |
| Uruguayans | 1.3 /100 | #249 | Tragic 94.1% |
| Immigrants | Hong Kong | 1.3 /100 | #250 | Tragic 94.1% |
| Jamaicans | 1.0 /100 | #251 | Tragic 94.1% |
| Immigrants | Senegal | 0.9 /100 | #252 | Tragic 94.1% |
| Colombians | 0.8 /100 | #253 | Tragic 94.0% |
| U.S. Virgin Islanders | 0.7 /100 | #254 | Tragic 94.0% |
| Immigrants | Nigeria | 0.6 /100 | #255 | Tragic 94.0% |
| Immigrants | Afghanistan | 0.5 /100 | #256 | Tragic 94.0% |
| Immigrants | Costa Rica | 0.5 /100 | #257 | Tragic 94.0% |
| Immigrants | Thailand | 0.5 /100 | #258 | Tragic 93.9% |
| Ghanaians | 0.5 /100 | #259 | Tragic 93.9% |
| Pima | 0.4 /100 | #260 | Tragic 93.9% |