Czechoslovakian vs Immigrants from Dominica Single Mother Households
COMPARE
Czechoslovakian
Immigrants from Dominica
Single Mother Households
Single Mother Households Comparison
Czechoslovakians
Immigrants from Dominica
5.9%
SINGLE MOTHER HOUSEHOLDS
92.2/ 100
METRIC RATING
128th/ 347
METRIC RANK
8.7%
SINGLE MOTHER HOUSEHOLDS
0.0/ 100
METRIC RATING
335th/ 347
METRIC RANK
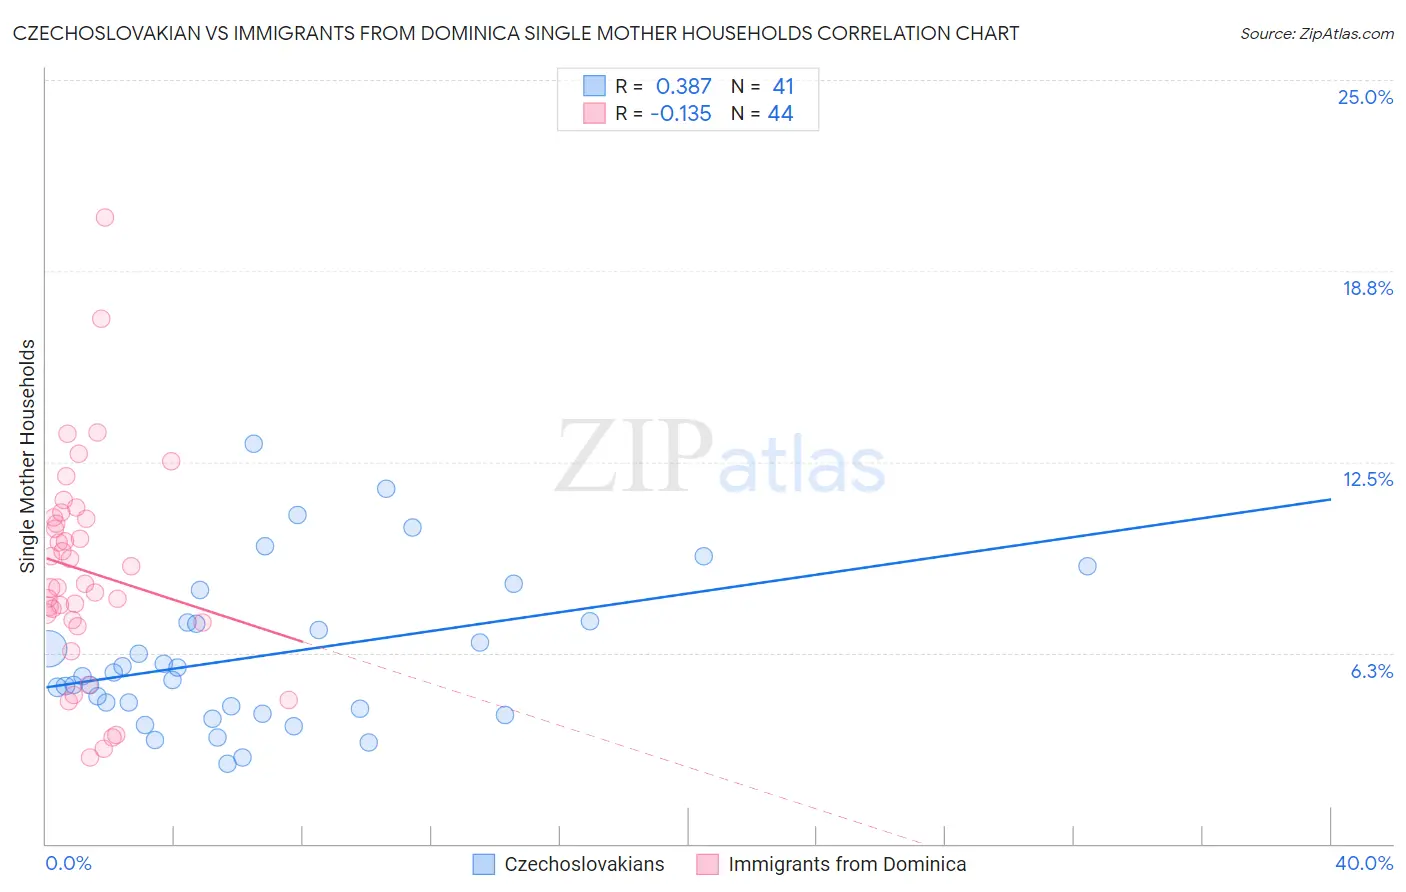
Czechoslovakian vs Immigrants from Dominica Single Mother Households Correlation Chart
The statistical analysis conducted on geographies consisting of 367,454,114 people shows a mild positive correlation between the proportion of Czechoslovakians and percentage of single mother households in the United States with a correlation coefficient (R) of 0.387 and weighted average of 5.9%. Similarly, the statistical analysis conducted on geographies consisting of 83,777,287 people shows a poor negative correlation between the proportion of Immigrants from Dominica and percentage of single mother households in the United States with a correlation coefficient (R) of -0.135 and weighted average of 8.7%, a difference of 48.4%.
Single Mother Households Correlation Summary
| Measurement | Czechoslovakian | Immigrants from Dominica |
| Minimum | 2.6% | 2.8% |
| Maximum | 13.1% | 20.5% |
| Range | 10.5% | 17.7% |
| Mean | 6.2% | 8.9% |
| Median | 5.5% | 8.5% |
| Interquartile 25% (IQ1) | 4.3% | 7.3% |
| Interquartile 75% (IQ3) | 7.3% | 10.7% |
| Interquartile Range (IQR) | 2.9% | 3.4% |
| Standard Deviation (Sample) | 2.5% | 3.5% |
| Standard Deviation (Population) | 2.5% | 3.5% |
Similar Demographics by Single Mother Households
Demographics Similar to Czechoslovakians by Single Mother Households
In terms of single mother households, the demographic groups most similar to Czechoslovakians are Immigrants from Bolivia (5.9%, a difference of 0.010%), Palestinian (5.9%, a difference of 0.040%), Lebanese (5.9%, a difference of 0.080%), Welsh (5.9%, a difference of 0.27%), and Slavic (5.9%, a difference of 0.29%).
| Demographics | Rating | Rank | Single Mother Households |
| Argentineans | 93.7 /100 | #121 | Exceptional 5.8% |
| Belgians | 93.5 /100 | #122 | Exceptional 5.8% |
| Immigrants | Uzbekistan | 93.4 /100 | #123 | Exceptional 5.9% |
| Immigrants | Argentina | 93.2 /100 | #124 | Exceptional 5.9% |
| Slavs | 92.9 /100 | #125 | Exceptional 5.9% |
| Welsh | 92.8 /100 | #126 | Exceptional 5.9% |
| Lebanese | 92.4 /100 | #127 | Exceptional 5.9% |
| Czechoslovakians | 92.2 /100 | #128 | Exceptional 5.9% |
| Immigrants | Bolivia | 92.2 /100 | #129 | Exceptional 5.9% |
| Palestinians | 92.1 /100 | #130 | Exceptional 5.9% |
| Immigrants | Spain | 91.2 /100 | #131 | Exceptional 5.9% |
| Albanians | 91.1 /100 | #132 | Exceptional 5.9% |
| Egyptians | 90.7 /100 | #133 | Exceptional 5.9% |
| Canadians | 90.5 /100 | #134 | Exceptional 5.9% |
| Immigrants | Saudi Arabia | 90.2 /100 | #135 | Exceptional 5.9% |
Demographics Similar to Immigrants from Dominica by Single Mother Households
In terms of single mother households, the demographic groups most similar to Immigrants from Dominica are Puerto Rican (8.7%, a difference of 0.040%), Immigrants from Liberia (8.7%, a difference of 0.29%), Liberian (8.6%, a difference of 1.1%), Navajo (8.8%, a difference of 1.2%), and Cape Verdean (8.9%, a difference of 1.3%).
| Demographics | Rating | Rank | Single Mother Households |
| Yakama | 0.0 /100 | #328 | Tragic 8.4% |
| Hopi | 0.0 /100 | #329 | Tragic 8.5% |
| Inupiat | 0.0 /100 | #330 | Tragic 8.5% |
| Sioux | 0.0 /100 | #331 | Tragic 8.5% |
| U.S. Virgin Islanders | 0.0 /100 | #332 | Tragic 8.6% |
| Liberians | 0.0 /100 | #333 | Tragic 8.6% |
| Immigrants | Liberia | 0.0 /100 | #334 | Tragic 8.7% |
| Immigrants | Dominica | 0.0 /100 | #335 | Tragic 8.7% |
| Puerto Ricans | 0.0 /100 | #336 | Tragic 8.7% |
| Navajo | 0.0 /100 | #337 | Tragic 8.8% |
| Cape Verdeans | 0.0 /100 | #338 | Tragic 8.9% |
| Blacks/African Americans | 0.0 /100 | #339 | Tragic 9.0% |
| Lumbee | 0.0 /100 | #340 | Tragic 9.1% |
| Tohono O'odham | 0.0 /100 | #341 | Tragic 9.1% |
| Menominee | 0.0 /100 | #342 | Tragic 9.2% |