Palestinian vs British West Indian 10th Grade
COMPARE
Palestinian
British West Indian
10th Grade
10th Grade Comparison
Palestinians
British West Indians
94.4%
10TH GRADE
96.5/ 100
METRIC RATING
113th/ 347
METRIC RANK
91.8%
10TH GRADE
0.0/ 100
METRIC RATING
290th/ 347
METRIC RANK
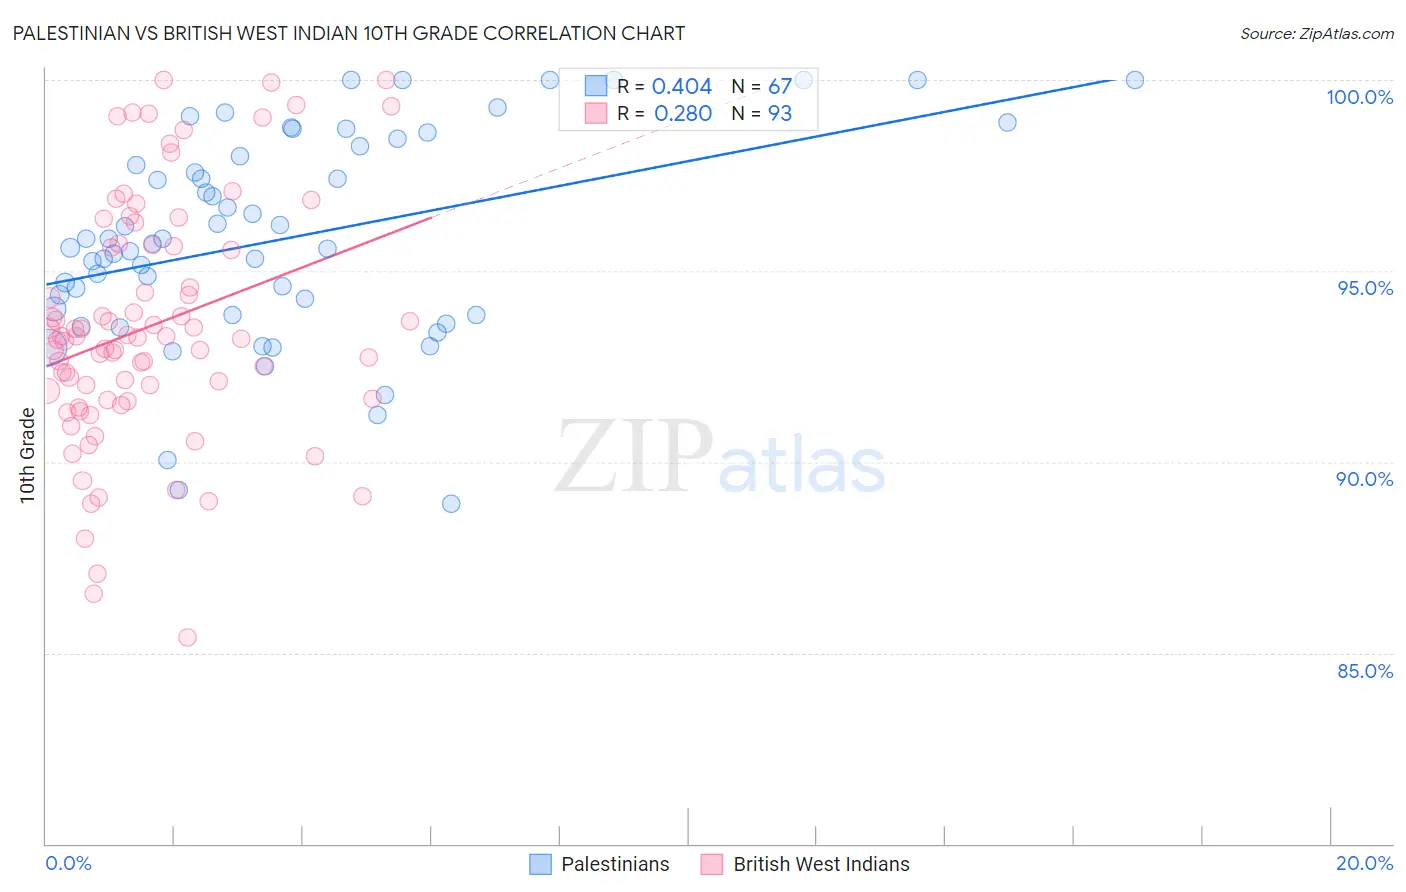
Palestinian vs British West Indian 10th Grade Correlation Chart
The statistical analysis conducted on geographies consisting of 216,424,519 people shows a moderate positive correlation between the proportion of Palestinians and percentage of population with at least 10th grade education in the United States with a correlation coefficient (R) of 0.404 and weighted average of 94.4%. Similarly, the statistical analysis conducted on geographies consisting of 152,698,597 people shows a weak positive correlation between the proportion of British West Indians and percentage of population with at least 10th grade education in the United States with a correlation coefficient (R) of 0.280 and weighted average of 91.8%, a difference of 2.8%.
10th Grade Correlation Summary
| Measurement | Palestinian | British West Indian |
| Minimum | 88.9% | 85.4% |
| Maximum | 100.0% | 100.0% |
| Range | 11.1% | 14.6% |
| Mean | 95.9% | 93.5% |
| Median | 95.7% | 93.2% |
| Interquartile 25% (IQ1) | 93.8% | 91.6% |
| Interquartile 75% (IQ3) | 98.3% | 95.7% |
| Interquartile Range (IQR) | 4.4% | 4.0% |
| Standard Deviation (Sample) | 2.7% | 3.2% |
| Standard Deviation (Population) | 2.7% | 3.1% |
Similar Demographics by 10th Grade
Demographics Similar to Palestinians by 10th Grade
In terms of 10th grade, the demographic groups most similar to Palestinians are Immigrants from Zimbabwe (94.4%, a difference of 0.020%), Immigrants from Kuwait (94.4%, a difference of 0.020%), German Russian (94.4%, a difference of 0.020%), Delaware (94.4%, a difference of 0.020%), and Sioux (94.4%, a difference of 0.020%).
| Demographics | Rating | Rank | 10th Grade |
| Immigrants | Serbia | 97.4 /100 | #106 | Exceptional 94.5% |
| Immigrants | Croatia | 97.4 /100 | #107 | Exceptional 94.5% |
| Immigrants | North Macedonia | 97.2 /100 | #108 | Exceptional 94.5% |
| Immigrants | Norway | 97.2 /100 | #109 | Exceptional 94.5% |
| Burmese | 97.1 /100 | #110 | Exceptional 94.5% |
| Immigrants | Zimbabwe | 96.8 /100 | #111 | Exceptional 94.4% |
| Immigrants | Kuwait | 96.8 /100 | #112 | Exceptional 94.4% |
| Palestinians | 96.5 /100 | #113 | Exceptional 94.4% |
| German Russians | 96.3 /100 | #114 | Exceptional 94.4% |
| Delaware | 96.3 /100 | #115 | Exceptional 94.4% |
| Sioux | 96.2 /100 | #116 | Exceptional 94.4% |
| Immigrants | Hungary | 95.8 /100 | #117 | Exceptional 94.4% |
| Jordanians | 95.6 /100 | #118 | Exceptional 94.4% |
| Immigrants | Israel | 95.4 /100 | #119 | Exceptional 94.4% |
| Immigrants | Taiwan | 95.3 /100 | #120 | Exceptional 94.4% |
Demographics Similar to British West Indians by 10th Grade
In terms of 10th grade, the demographic groups most similar to British West Indians are Immigrants from West Indies (91.8%, a difference of 0.0%), Immigrants from Burma/Myanmar (91.8%, a difference of 0.010%), Sri Lankan (91.8%, a difference of 0.020%), Indonesian (91.8%, a difference of 0.030%), and Pennsylvania German (91.9%, a difference of 0.060%).
| Demographics | Rating | Rank | 10th Grade |
| Immigrants | St. Vincent and the Grenadines | 0.0 /100 | #283 | Tragic 92.1% |
| Immigrants | Barbados | 0.0 /100 | #284 | Tragic 92.1% |
| Immigrants | South Eastern Asia | 0.0 /100 | #285 | Tragic 92.1% |
| Yuman | 0.0 /100 | #286 | Tragic 92.0% |
| Pennsylvania Germans | 0.0 /100 | #287 | Tragic 91.9% |
| Immigrants | Laos | 0.0 /100 | #288 | Tragic 91.9% |
| Sri Lankans | 0.0 /100 | #289 | Tragic 91.8% |
| British West Indians | 0.0 /100 | #290 | Tragic 91.8% |
| Immigrants | West Indies | 0.0 /100 | #291 | Tragic 91.8% |
| Immigrants | Burma/Myanmar | 0.0 /100 | #292 | Tragic 91.8% |
| Indonesians | 0.0 /100 | #293 | Tragic 91.8% |
| Haitians | 0.0 /100 | #294 | Tragic 91.8% |
| Lumbee | 0.0 /100 | #295 | Tragic 91.7% |
| Immigrants | Grenada | 0.0 /100 | #296 | Tragic 91.6% |
| Fijians | 0.0 /100 | #297 | Tragic 91.5% |