Zimbabwean vs Potawatomi Master's Degree

COMPARE

Zimbabwean
Race
Ancestry
AfghanAfricanAlaska NativeAlaskan AthabascanAlbanianAleutAlsatianAmericanApacheArabArapahoArgentineanArmenianAssyrian/Chaldean/SyriacAustralianAustrianBahamianBangladeshiBarbadianBasqueBelgianBelizeanBermudanBhutaneseBlackfeetBolivianBrazilianBritishBritish West IndianBulgarianBurmeseCajunCambodianCanadianCape VerdeanCarpatho RusynCelticCentral AmericanCentral American IndianCherokeeCheyenneChickasawChileanChineseChippewaChoctawColombianColvilleComancheCosta RicanCreeCreekCroatianCrowCubanCypriotCzechCzechoslovakianDanishDelawareDominicanDutchDutch West IndianEastern EuropeanEcuadorianEgyptianEnglishEstonianEthiopianEuropeanFijianFilipinoFinnishFrenchFrench American IndianFrench CanadianGermanGerman RussianGhanaianGreekGuamanian/ChamorroGuatemalanGuyaneseHaitianHmongHonduranHopiHoumaHungarianIcelanderIndian (Asian)IndonesianInupiatIranianIraqiIrishIroquoisIsraeliItalianJamaicanJapaneseJordanianKenyanKiowaKoreanLaotianLatvianLebaneseLiberianLithuanianLumbeeLuxembourgerMacedonianMalaysianMalteseMarshalleseMenomineeMexicanMexican American IndianMongolianMoroccanNative HawaiianNavajoNepaleseNew ZealanderNicaraguanNigerianNorthern EuropeanNorwegianOkinawanOsageOttawaPaiutePakistaniPalestinianPanamanianParaguayanPennsylvania GermanPeruvianPimaPolishPortuguesePuebloPuerto RicanPuget Sound SalishRomanianRussianSalvadoranSamoanScandinavianScotch-IrishScottishSeminoleSenegaleseSerbianShoshoneSierra LeoneanSiouxSlavicSlovakSloveneSomaliSouth AfricanSouth AmericanSouth American IndianSoviet UnionSpaniardSpanishSpanish AmericanSpanish American IndianSri LankanSubsaharan AfricanSudaneseSwedishSwissSyrianTaiwaneseThaiTlingit-HaidaTohono O'OdhamTonganTrinidadian and TobagonianTsimshianTurkishU.S. Virgin IslanderUgandanUkrainianUruguayanUteVenezuelanVietnameseWelshWest IndianYakamaYaquiYugoslavianYumanYup'ikZimbabwean
Immigration
NonimmigrantsImmigrantsAfghanistanAfricaAlbaniaArgentinaArmeniaAsiaAustraliaAustriaBahamasBangladeshBarbadosBelarusBelgiumBelizeBoliviaBosnia and HerzegovinaBrazilBulgariaBurma/MyanmarCabo VerdeCambodiaCameroonCanadaCaribbeanCentral AmericaChileChinaColombiaCongoCosta RicaCroatiaCubaCzechoslovakiaDenmarkDominicaDominican RepublicEastern AfricaEastern AsiaEastern EuropeEcuadorEgyptEl SalvadorEnglandEritreaEthiopiaEuropeFijiFranceGermanyGhanaGreeceGrenadaGuatemalaGuyanaHaitiHondurasHong KongHungaryIndiaIndonesiaIranIraqIrelandIsraelItalyJamaicaJapanJordanKazakhstanKenyaKoreaKuwaitLaosLatin AmericaLatviaLebanonLiberiaLithuaniaMalaysiaMexicoMicronesiaMiddle AfricaMoldovaMoroccoNepalNetherlandsNicaraguaNigeriaNorth AmericaNorth MacedoniaNorthern AfricaNorthern EuropeNorwayOceaniaPakistanPanamaPeruPhilippinesPolandPortugalRomaniaRussiaSaudi ArabiaScotlandSenegalSerbiaSierra LeoneSingaporeSomaliaSouth AfricaSouth AmericaSouth Central AsiaSouth Eastern AsiaSouthern EuropeSpainSri LankaSt. Vincent and the GrenadinesSudanSwedenSwitzerlandSyriaTaiwanThailandTrinidad and TobagoTurkeyUgandaUkraineUruguayUzbekistanVenezuelaVietnamWest IndiesWestern AfricaWestern AsiaWestern EuropeYemenZaireZimbabweAzores
Potawatomi
Race
Ancestry
AfghanAfricanAlaska NativeAlaskan AthabascanAlbanianAleutAlsatianAmericanApacheArabArapahoArgentineanArmenianAssyrian/Chaldean/SyriacAustralianAustrianBahamianBangladeshiBarbadianBasqueBelgianBelizeanBermudanBhutaneseBlackfeetBolivianBrazilianBritishBritish West IndianBulgarianBurmeseCajunCambodianCanadianCape VerdeanCarpatho RusynCelticCentral AmericanCentral American IndianCherokeeCheyenneChickasawChileanChineseChippewaChoctawColombianColvilleComancheCosta RicanCreeCreekCroatianCrowCubanCypriotCzechCzechoslovakianDanishDelawareDominicanDutchDutch West IndianEastern EuropeanEcuadorianEgyptianEnglishEstonianEthiopianEuropeanFijianFilipinoFinnishFrenchFrench American IndianFrench CanadianGermanGerman RussianGhanaianGreekGuamanian/ChamorroGuatemalanGuyaneseHaitianHmongHonduranHopiHoumaHungarianIcelanderIndian (Asian)IndonesianInupiatIranianIraqiIrishIroquoisIsraeliItalianJamaicanJapaneseJordanianKenyanKiowaKoreanLaotianLatvianLebaneseLiberianLithuanianLumbeeLuxembourgerMacedonianMalaysianMalteseMarshalleseMenomineeMexicanMexican American IndianMongolianMoroccanNative HawaiianNavajoNepaleseNew ZealanderNicaraguanNigerianNorthern EuropeanNorwegianOkinawanOsageOttawaPaiutePakistaniPalestinianPanamanianParaguayanPennsylvania GermanPeruvianPimaPolishPortuguesePotawatomiPuebloPuerto RicanPuget Sound SalishRomanianRussianSalvadoranSamoanScandinavianScotch-IrishScottishSeminoleSenegaleseSerbianShoshoneSierra LeoneanSiouxSlavicSlovakSloveneSomaliSouth AfricanSouth AmericanSouth American IndianSoviet UnionSpaniardSpanishSpanish AmericanSpanish American IndianSri LankanSubsaharan AfricanSudaneseSwedishSwissSyrianTaiwaneseThaiTlingit-HaidaTohono O'OdhamTonganTrinidadian and TobagonianTsimshianTurkishU.S. Virgin IslanderUgandanUkrainianUruguayanUteVenezuelanVietnameseWelshWest IndianYakamaYaquiYugoslavianYumanYup'ik
Immigration
NonimmigrantsImmigrantsAfghanistanAfricaAlbaniaArgentinaArmeniaAsiaAustraliaAustriaBahamasBangladeshBarbadosBelarusBelgiumBelizeBoliviaBosnia and HerzegovinaBrazilBulgariaBurma/MyanmarCabo VerdeCambodiaCameroonCanadaCaribbeanCentral AmericaChileChinaColombiaCongoCosta RicaCroatiaCubaCzechoslovakiaDenmarkDominicaDominican RepublicEastern AfricaEastern AsiaEastern EuropeEcuadorEgyptEl SalvadorEnglandEritreaEthiopiaEuropeFijiFranceGermanyGhanaGreeceGrenadaGuatemalaGuyanaHaitiHondurasHong KongHungaryIndiaIndonesiaIranIraqIrelandIsraelItalyJamaicaJapanJordanKazakhstanKenyaKoreaKuwaitLaosLatin AmericaLatviaLebanonLiberiaLithuaniaMalaysiaMexicoMicronesiaMiddle AfricaMoldovaMoroccoNepalNetherlandsNicaraguaNigeriaNorth AmericaNorth MacedoniaNorthern AfricaNorthern EuropeNorwayOceaniaPakistanPanamaPeruPhilippinesPolandPortugalRomaniaRussiaSaudi ArabiaScotlandSenegalSerbiaSierra LeoneSingaporeSomaliaSouth AfricaSouth AmericaSouth Central AsiaSouth Eastern AsiaSouthern EuropeSpainSri LankaSt. Vincent and the GrenadinesSudanSwedenSwitzerlandSyriaTaiwanThailandTrinidad and TobagoTurkeyUgandaUkraineUruguayUzbekistanVenezuelaVietnamWest IndiesWestern AfricaWestern AsiaWestern EuropeYemenZaireZimbabweAzores
Master's Degree
Income
Poverty
Unemployment
Labor Participation
Family Structure
Vehicle Availability
Education Level
Disability

Master's Degree Comparison

Zimbabweans

Potawatomi

Exceptional
Tragic
17.7%
MASTER'S DEGREE
99.7/ 100
METRIC RATING
73rd/ 347
METRIC RANK
12.1%
MASTER'S DEGREE
0.3/ 100
METRIC RATING
278th/ 347
METRIC RANK

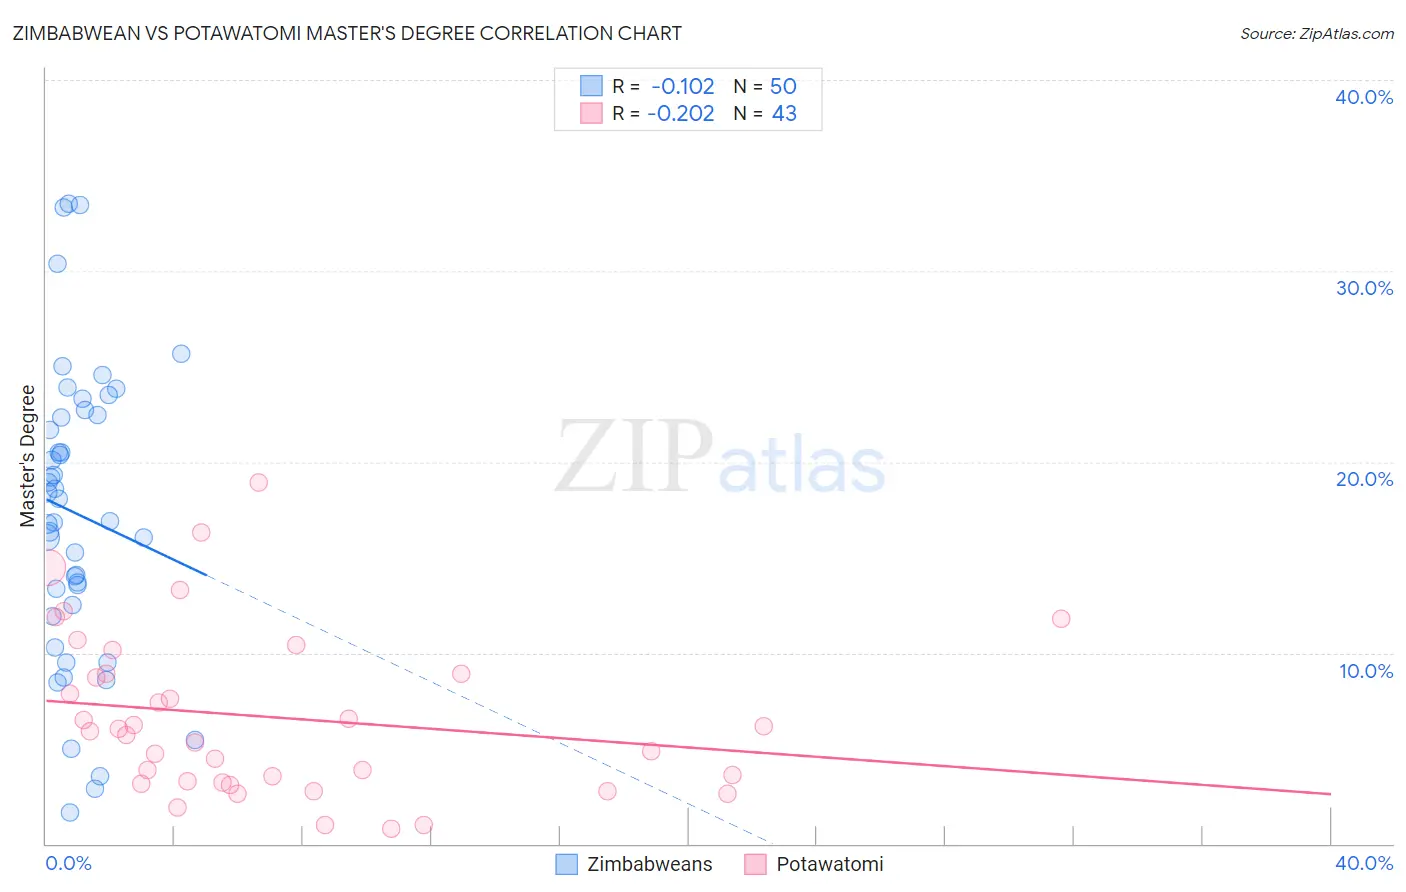
Zimbabwean vs Potawatomi Master's Degree Correlation Chart

The statistical analysis conducted on geographies consisting of 69,201,212 people shows a poor negative correlation between the proportion of Zimbabweans and percentage of population with at least master's degree education in the United States with a correlation coefficient (R) of -0.102 and weighted average of 17.7%. Similarly, the statistical analysis conducted on geographies consisting of 117,752,178 people shows a weak negative correlation between the proportion of Potawatomi and percentage of population with at least master's degree education in the United States with a correlation coefficient (R) of -0.202 and weighted average of 12.1%, a difference of 46.9%.
Zimbabwean vs Potawatomi Master's Degree

Master's Degree Correlation Summary

MeasurementZimbabweanPotawatomi
Minimum1.7%0.76%
Maximum33.5%18.9%
Range31.8%18.1%
Mean17.3%6.6%
Median17.5%5.9%
Interquartile 25% (IQ1)12.5%3.2%
Interquartile 75% (IQ3)22.4%8.9%
Interquartile Range (IQR)9.9%5.7%
Standard Deviation (Sample)7.7%4.3%
Standard Deviation (Population)7.6%4.3%

Similar Demographics by Master's Degree

Demographics Similar to Zimbabweans by Master's Degree

In terms of master's degree, the demographic groups most similar to Zimbabweans are Lithuanian (17.7%, a difference of 0.11%), Immigrants from Pakistan (17.8%, a difference of 0.28%), Immigrants from Romania (17.7%, a difference of 0.31%), Immigrants from Western Europe (17.8%, a difference of 0.57%), and Egyptian (17.6%, a difference of 0.69%).
DemographicsRating | RankMaster's Degree
Ethiopians
99.8
/100
|
#66
Exceptional
18.0%
Immigrants | Argentina
99.8
/100
|
#67
Exceptional
18.0%
Immigrants | Ethiopia
99.8
/100
|
#68
Exceptional
17.9%
Immigrants | Uzbekistan
99.8
/100
|
#69
Exceptional
17.9%
Immigrants | Western Europe
99.8
/100
|
#70
Exceptional
17.8%
Immigrants | Pakistan
99.7
/100
|
#71
Exceptional
17.8%
Lithuanians
99.7
/100
|
#72
Exceptional
17.7%
Zimbabweans
99.7
/100
|
#73
Exceptional
17.7%
Immigrants | Romania
99.7
/100
|
#74
Exceptional
17.7%
Egyptians
99.6
/100
|
#75
Exceptional
17.6%
Immigrants | Indonesia
99.6
/100
|
#76
Exceptional
17.6%
Immigrants | Eastern Europe
99.6
/100
|
#77
Exceptional
17.6%
Immigrants | Hungary
99.6
/100
|
#78
Exceptional
17.5%
Immigrants | Lebanon
99.6
/100
|
#79
Exceptional
17.5%
Carpatho Rusyns
99.6
/100
|
#80
Exceptional
17.5%

Demographics Similar to Potawatomi by Master's Degree

In terms of master's degree, the demographic groups most similar to Potawatomi are Immigrants from Caribbean (12.1%, a difference of 0.0%), Black/African American (12.1%, a difference of 0.010%), Cuban (12.1%, a difference of 0.070%), Cape Verdean (12.1%, a difference of 0.080%), and Immigrants from Belize (12.1%, a difference of 0.080%).
DemographicsRating | RankMaster's Degree
Haitians
0.3
/100
|
#271
Tragic
12.1%
Comanche
0.3
/100
|
#272
Tragic
12.1%
Blackfeet
0.3
/100
|
#273
Tragic
12.1%
Cape Verdeans
0.3
/100
|
#274
Tragic
12.1%
Cubans
0.3
/100
|
#275
Tragic
12.1%
Blacks/African Americans
0.3
/100
|
#276
Tragic
12.1%
Immigrants | Caribbean
0.3
/100
|
#277
Tragic
12.1%
Potawatomi
0.3
/100
|
#278
Tragic
12.1%
Immigrants | Belize
0.2
/100
|
#279
Tragic
12.1%
Immigrants | Dominican Republic
0.2
/100
|
#280
Tragic
12.1%
Malaysians
0.2
/100
|
#281
Tragic
12.0%
Immigrants | El Salvador
0.2
/100
|
#282
Tragic
12.0%
Hondurans
0.2
/100
|
#283
Tragic
11.9%
Ottawa
0.2
/100
|
#284
Tragic
11.9%
Immigrants | Nicaragua
0.2
/100
|
#285
Tragic
11.8%