Barbadian vs Potawatomi Master's Degree
COMPARE
Barbadian
Potawatomi
Master's Degree
Master's Degree Comparison
Barbadians
Potawatomi
14.7%
MASTER'S DEGREE
38.3/ 100
METRIC RATING
185th/ 347
METRIC RANK
12.1%
MASTER'S DEGREE
0.3/ 100
METRIC RATING
278th/ 347
METRIC RANK
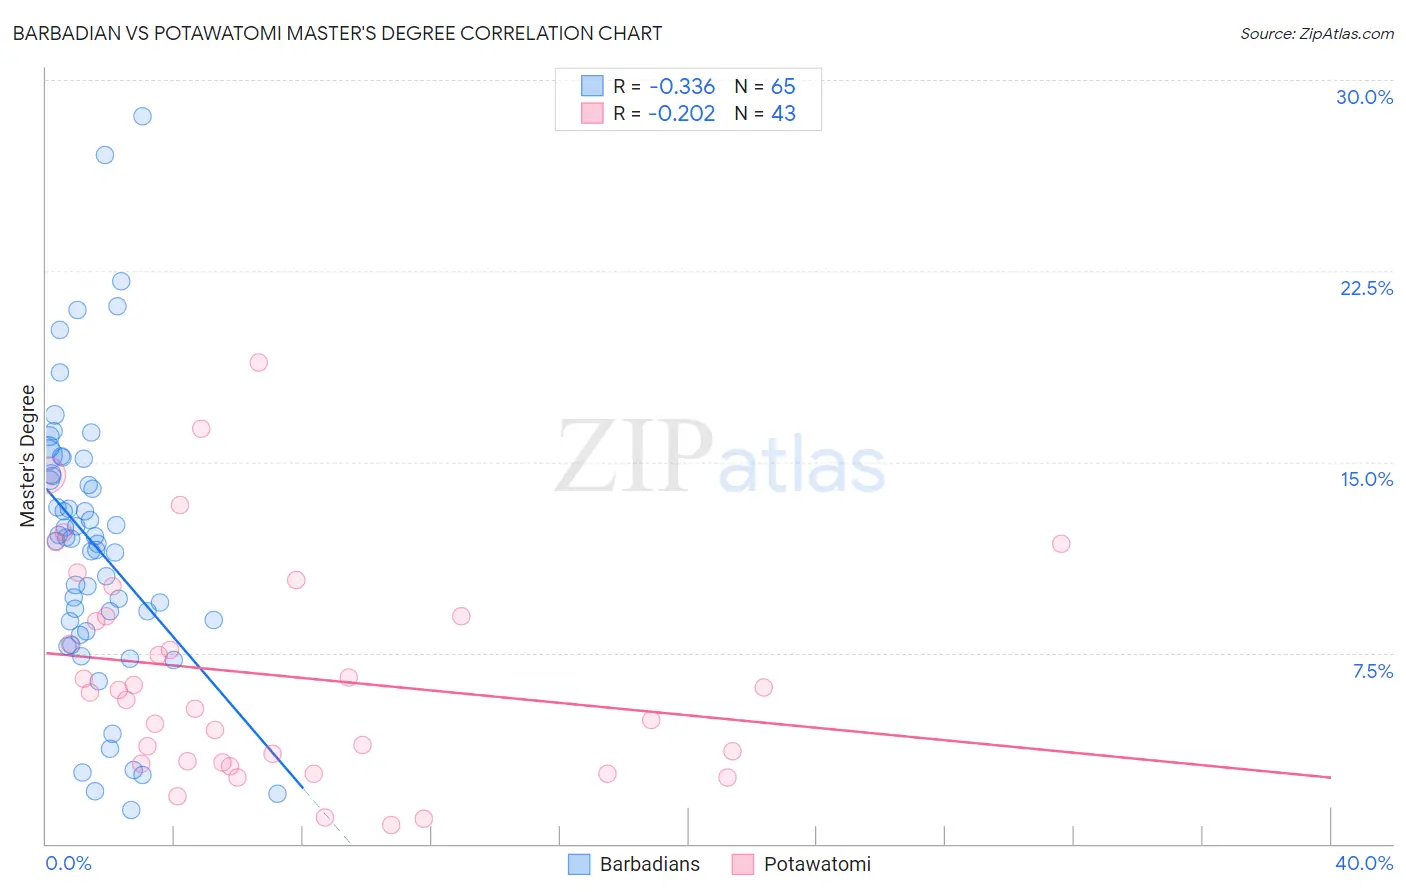
Barbadian vs Potawatomi Master's Degree Correlation Chart
The statistical analysis conducted on geographies consisting of 141,295,257 people shows a mild negative correlation between the proportion of Barbadians and percentage of population with at least master's degree education in the United States with a correlation coefficient (R) of -0.336 and weighted average of 14.7%. Similarly, the statistical analysis conducted on geographies consisting of 117,752,178 people shows a weak negative correlation between the proportion of Potawatomi and percentage of population with at least master's degree education in the United States with a correlation coefficient (R) of -0.202 and weighted average of 12.1%, a difference of 21.8%.
Master's Degree Correlation Summary
| Measurement | Barbadian | Potawatomi |
| Minimum | 1.3% | 0.76% |
| Maximum | 28.6% | 18.9% |
| Range | 27.2% | 18.1% |
| Mean | 11.8% | 6.6% |
| Median | 12.0% | 5.9% |
| Interquartile 25% (IQ1) | 8.6% | 3.2% |
| Interquartile 75% (IQ3) | 14.8% | 8.9% |
| Interquartile Range (IQR) | 6.3% | 5.7% |
| Standard Deviation (Sample) | 5.5% | 4.3% |
| Standard Deviation (Population) | 5.5% | 4.3% |
Similar Demographics by Master's Degree
Demographics Similar to Barbadians by Master's Degree
In terms of master's degree, the demographic groups most similar to Barbadians are Immigrants from Zaire (14.7%, a difference of 0.16%), Immigrants from Oceania (14.7%, a difference of 0.16%), Sri Lankan (14.7%, a difference of 0.18%), Basque (14.7%, a difference of 0.24%), and Czech (14.7%, a difference of 0.28%).
| Demographics | Rating | Rank | Master's Degree |
| English | 45.0 /100 | #178 | Average 14.8% |
| Immigrants | Iraq | 41.3 /100 | #179 | Average 14.8% |
| Celtics | 41.3 /100 | #180 | Average 14.8% |
| Swiss | 41.1 /100 | #181 | Average 14.7% |
| Czechs | 40.4 /100 | #182 | Average 14.7% |
| Sri Lankans | 39.6 /100 | #183 | Fair 14.7% |
| Immigrants | Zaire | 39.5 /100 | #184 | Fair 14.7% |
| Barbadians | 38.3 /100 | #185 | Fair 14.7% |
| Immigrants | Oceania | 37.1 /100 | #186 | Fair 14.7% |
| Basques | 36.5 /100 | #187 | Fair 14.7% |
| Immigrants | Costa Rica | 36.2 /100 | #188 | Fair 14.7% |
| Immigrants | Immigrants | 36.0 /100 | #189 | Fair 14.6% |
| Spaniards | 35.8 /100 | #190 | Fair 14.6% |
| Welsh | 34.2 /100 | #191 | Fair 14.6% |
| Immigrants | Middle Africa | 33.6 /100 | #192 | Fair 14.6% |
Demographics Similar to Potawatomi by Master's Degree
In terms of master's degree, the demographic groups most similar to Potawatomi are Immigrants from Caribbean (12.1%, a difference of 0.0%), Black/African American (12.1%, a difference of 0.010%), Cuban (12.1%, a difference of 0.070%), Cape Verdean (12.1%, a difference of 0.080%), and Immigrants from Belize (12.1%, a difference of 0.080%).
| Demographics | Rating | Rank | Master's Degree |
| Haitians | 0.3 /100 | #271 | Tragic 12.1% |
| Comanche | 0.3 /100 | #272 | Tragic 12.1% |
| Blackfeet | 0.3 /100 | #273 | Tragic 12.1% |
| Cape Verdeans | 0.3 /100 | #274 | Tragic 12.1% |
| Cubans | 0.3 /100 | #275 | Tragic 12.1% |
| Blacks/African Americans | 0.3 /100 | #276 | Tragic 12.1% |
| Immigrants | Caribbean | 0.3 /100 | #277 | Tragic 12.1% |
| Potawatomi | 0.3 /100 | #278 | Tragic 12.1% |
| Immigrants | Belize | 0.2 /100 | #279 | Tragic 12.1% |
| Immigrants | Dominican Republic | 0.2 /100 | #280 | Tragic 12.1% |
| Malaysians | 0.2 /100 | #281 | Tragic 12.0% |
| Immigrants | El Salvador | 0.2 /100 | #282 | Tragic 12.0% |
| Hondurans | 0.2 /100 | #283 | Tragic 11.9% |
| Ottawa | 0.2 /100 | #284 | Tragic 11.9% |
| Immigrants | Nicaragua | 0.2 /100 | #285 | Tragic 11.8% |