Immigrants from Panama vs Potawatomi Master's Degree
COMPARE
Immigrants from Panama
Potawatomi
Master's Degree
Master's Degree Comparison
Immigrants from Panama
Potawatomi
14.3%
MASTER'S DEGREE
20.0/ 100
METRIC RATING
209th/ 347
METRIC RANK
12.1%
MASTER'S DEGREE
0.3/ 100
METRIC RATING
278th/ 347
METRIC RANK
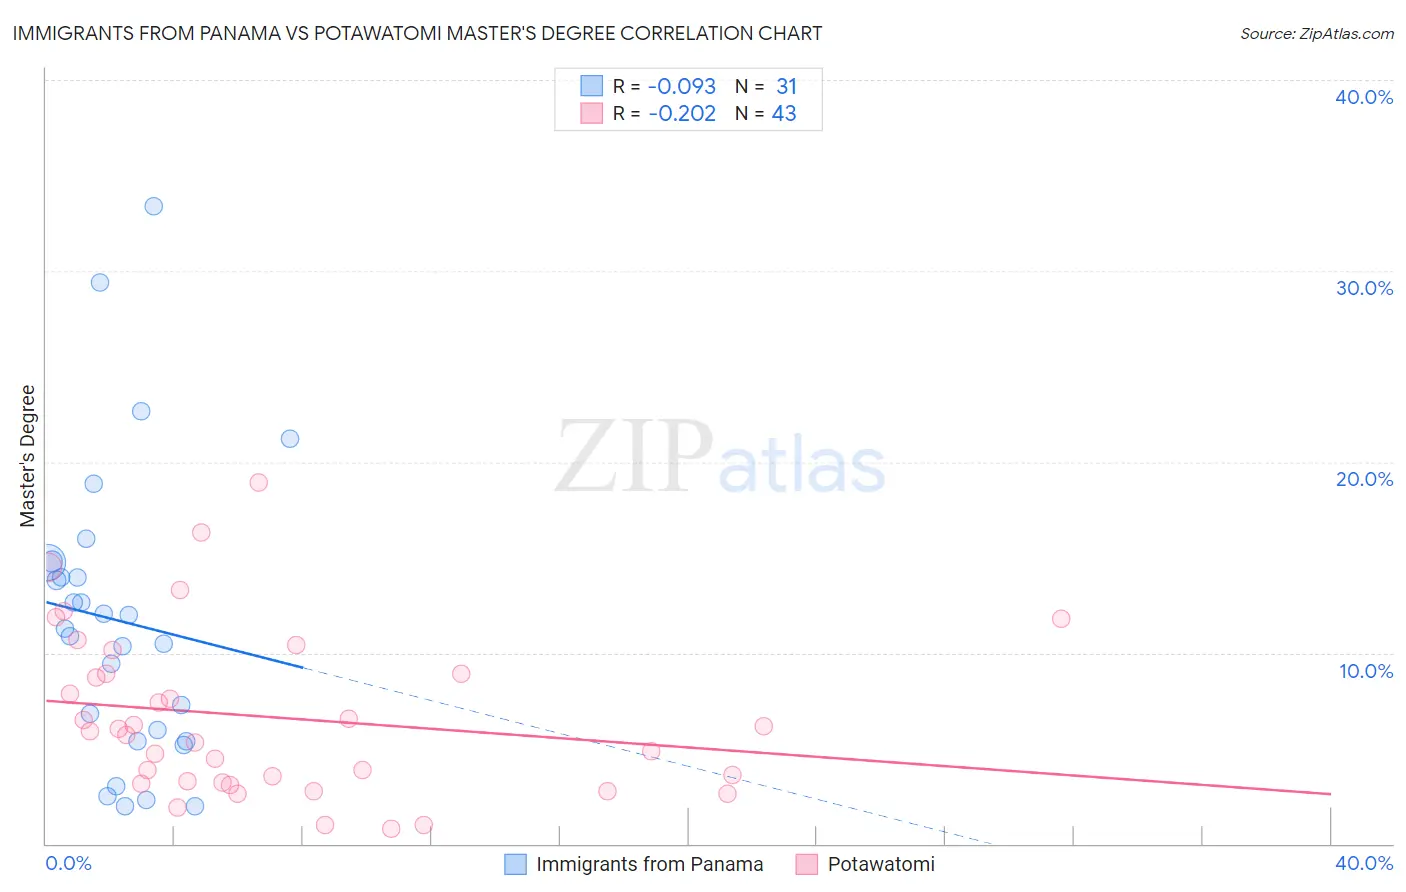
Immigrants from Panama vs Potawatomi Master's Degree Correlation Chart
The statistical analysis conducted on geographies consisting of 221,161,051 people shows a slight negative correlation between the proportion of Immigrants from Panama and percentage of population with at least master's degree education in the United States with a correlation coefficient (R) of -0.093 and weighted average of 14.3%. Similarly, the statistical analysis conducted on geographies consisting of 117,752,178 people shows a weak negative correlation between the proportion of Potawatomi and percentage of population with at least master's degree education in the United States with a correlation coefficient (R) of -0.202 and weighted average of 12.1%, a difference of 18.2%.
Master's Degree Correlation Summary
| Measurement | Immigrants from Panama | Potawatomi |
| Minimum | 1.9% | 0.76% |
| Maximum | 33.4% | 18.9% |
| Range | 31.4% | 18.1% |
| Mean | 11.7% | 6.6% |
| Median | 11.3% | 5.9% |
| Interquartile 25% (IQ1) | 5.4% | 3.2% |
| Interquartile 75% (IQ3) | 14.7% | 8.9% |
| Interquartile Range (IQR) | 9.4% | 5.7% |
| Standard Deviation (Sample) | 7.6% | 4.3% |
| Standard Deviation (Population) | 7.5% | 4.3% |
Similar Demographics by Master's Degree
Demographics Similar to Immigrants from Panama by Master's Degree
In terms of master's degree, the demographic groups most similar to Immigrants from Panama are Immigrants from Barbados (14.3%, a difference of 0.090%), Subsaharan African (14.2%, a difference of 0.13%), Immigrants from Bosnia and Herzegovina (14.3%, a difference of 0.39%), Somali (14.2%, a difference of 0.44%), and Spanish (14.2%, a difference of 0.49%).
| Demographics | Rating | Rank | Master's Degree |
| Immigrants | Western Africa | 24.9 /100 | #202 | Fair 14.4% |
| Yugoslavians | 24.3 /100 | #203 | Fair 14.4% |
| French | 23.7 /100 | #204 | Fair 14.4% |
| Trinidadians and Tobagonians | 23.5 /100 | #205 | Fair 14.4% |
| Scandinavians | 23.3 /100 | #206 | Fair 14.4% |
| Immigrants | Bosnia and Herzegovina | 22.0 /100 | #207 | Fair 14.3% |
| Immigrants | Barbados | 20.5 /100 | #208 | Fair 14.3% |
| Immigrants | Panama | 20.0 /100 | #209 | Fair 14.3% |
| Sub-Saharan Africans | 19.4 /100 | #210 | Poor 14.2% |
| Somalis | 18.0 /100 | #211 | Poor 14.2% |
| Spanish | 17.8 /100 | #212 | Poor 14.2% |
| Immigrants | Thailand | 17.0 /100 | #213 | Poor 14.2% |
| Finns | 16.9 /100 | #214 | Poor 14.2% |
| Immigrants | Vietnam | 16.1 /100 | #215 | Poor 14.1% |
| Immigrants | Somalia | 15.8 /100 | #216 | Poor 14.1% |
Demographics Similar to Potawatomi by Master's Degree
In terms of master's degree, the demographic groups most similar to Potawatomi are Immigrants from Caribbean (12.1%, a difference of 0.0%), Black/African American (12.1%, a difference of 0.010%), Cuban (12.1%, a difference of 0.070%), Cape Verdean (12.1%, a difference of 0.080%), and Immigrants from Belize (12.1%, a difference of 0.080%).
| Demographics | Rating | Rank | Master's Degree |
| Haitians | 0.3 /100 | #271 | Tragic 12.1% |
| Comanche | 0.3 /100 | #272 | Tragic 12.1% |
| Blackfeet | 0.3 /100 | #273 | Tragic 12.1% |
| Cape Verdeans | 0.3 /100 | #274 | Tragic 12.1% |
| Cubans | 0.3 /100 | #275 | Tragic 12.1% |
| Blacks/African Americans | 0.3 /100 | #276 | Tragic 12.1% |
| Immigrants | Caribbean | 0.3 /100 | #277 | Tragic 12.1% |
| Potawatomi | 0.3 /100 | #278 | Tragic 12.1% |
| Immigrants | Belize | 0.2 /100 | #279 | Tragic 12.1% |
| Immigrants | Dominican Republic | 0.2 /100 | #280 | Tragic 12.1% |
| Malaysians | 0.2 /100 | #281 | Tragic 12.0% |
| Immigrants | El Salvador | 0.2 /100 | #282 | Tragic 12.0% |
| Hondurans | 0.2 /100 | #283 | Tragic 11.9% |
| Ottawa | 0.2 /100 | #284 | Tragic 11.9% |
| Immigrants | Nicaragua | 0.2 /100 | #285 | Tragic 11.8% |