Cuban vs Immigrants from Uganda 1st Grade

COMPARE

Cuban
Race
Ancestry
AfghanAfricanAlaska NativeAlaskan AthabascanAlbanianAleutAlsatianAmericanApacheArabArapahoArgentineanArmenianAssyrian/Chaldean/SyriacAustralianAustrianBahamianBangladeshiBarbadianBasqueBelgianBelizeanBermudanBhutaneseBlackfeetBolivianBrazilianBritishBritish West IndianBulgarianBurmeseCajunCambodianCanadianCape VerdeanCarpatho RusynCelticCentral AmericanCentral American IndianCherokeeCheyenneChickasawChileanChineseChippewaChoctawColombianColvilleComancheCosta RicanCreeCreekCroatianCrowCubanCypriotCzechCzechoslovakianDanishDelawareDominicanDutchDutch West IndianEastern EuropeanEcuadorianEgyptianEnglishEstonianEthiopianEuropeanFijianFilipinoFinnishFrenchFrench American IndianFrench CanadianGermanGerman RussianGhanaianGreekGuamanian/ChamorroGuatemalanGuyaneseHaitianHmongHonduranHopiHoumaHungarianIcelanderIndian (Asian)IndonesianInupiatIranianIraqiIrishIroquoisIsraeliItalianJamaicanJapaneseJordanianKenyanKiowaKoreanLaotianLatvianLebaneseLiberianLithuanianLumbeeLuxembourgerMacedonianMalaysianMalteseMarshalleseMenomineeMexicanMexican American IndianMongolianMoroccanNative HawaiianNavajoNepaleseNew ZealanderNicaraguanNigerianNorthern EuropeanNorwegianOkinawanOsageOttawaPaiutePakistaniPalestinianPanamanianParaguayanPennsylvania GermanPeruvianPimaPolishPortuguesePotawatomiPuebloPuerto RicanPuget Sound SalishRomanianRussianSalvadoranSamoanScandinavianScotch-IrishScottishSeminoleSenegaleseSerbianShoshoneSierra LeoneanSiouxSlavicSlovakSloveneSomaliSouth AfricanSouth AmericanSouth American IndianSoviet UnionSpaniardSpanishSpanish AmericanSpanish American IndianSri LankanSubsaharan AfricanSudaneseSwedishSwissSyrianTaiwaneseThaiTlingit-HaidaTohono O'OdhamTonganTrinidadian and TobagonianTsimshianTurkishU.S. Virgin IslanderUgandanUkrainianUruguayanUteVenezuelanVietnameseWelshWest IndianYakamaYaquiYugoslavianYumanYup'ikZimbabwean
Immigration
NonimmigrantsImmigrantsAfghanistanAfricaAlbaniaArgentinaArmeniaAsiaAustraliaAustriaBahamasBangladeshBarbadosBelarusBelgiumBelizeBoliviaBosnia and HerzegovinaBrazilBulgariaBurma/MyanmarCabo VerdeCambodiaCameroonCanadaCaribbeanCentral AmericaChileChinaColombiaCongoCosta RicaCroatiaCubaCzechoslovakiaDenmarkDominicaDominican RepublicEastern AfricaEastern AsiaEastern EuropeEcuadorEgyptEl SalvadorEnglandEritreaEthiopiaEuropeFijiFranceGermanyGhanaGreeceGrenadaGuatemalaGuyanaHaitiHondurasHong KongHungaryIndiaIndonesiaIranIraqIrelandIsraelItalyJamaicaJapanJordanKazakhstanKenyaKoreaKuwaitLaosLatin AmericaLatviaLebanonLiberiaLithuaniaMalaysiaMexicoMicronesiaMiddle AfricaMoldovaMoroccoNepalNetherlandsNicaraguaNigeriaNorth AmericaNorth MacedoniaNorthern AfricaNorthern EuropeNorwayOceaniaPakistanPanamaPeruPhilippinesPolandPortugalRomaniaRussiaSaudi ArabiaScotlandSenegalSerbiaSierra LeoneSingaporeSomaliaSouth AfricaSouth AmericaSouth Central AsiaSouth Eastern AsiaSouthern EuropeSpainSri LankaSt. Vincent and the GrenadinesSudanSwedenSwitzerlandSyriaTaiwanThailandTrinidad and TobagoTurkeyUkraineUruguayUzbekistanVenezuelaVietnamWest IndiesWestern AfricaWestern AsiaWestern EuropeYemenZaireZimbabweAzores
Immigrants from Uganda
Race
Ancestry
AfghanAfricanAlaska NativeAlaskan AthabascanAlbanianAleutAlsatianAmericanApacheArabArapahoArgentineanArmenianAssyrian/Chaldean/SyriacAustralianAustrianBahamianBangladeshiBarbadianBasqueBelgianBelizeanBermudanBhutaneseBlackfeetBolivianBrazilianBritishBritish West IndianBulgarianBurmeseCajunCambodianCanadianCape VerdeanCarpatho RusynCelticCentral AmericanCentral American IndianCherokeeCheyenneChickasawChileanChineseChippewaChoctawColombianColvilleComancheCosta RicanCreeCreekCroatianCrowCypriotCzechCzechoslovakianDanishDelawareDominicanDutchDutch West IndianEastern EuropeanEcuadorianEgyptianEnglishEstonianEthiopianEuropeanFijianFilipinoFinnishFrenchFrench American IndianFrench CanadianGermanGerman RussianGhanaianGreekGuamanian/ChamorroGuatemalanGuyaneseHaitianHmongHonduranHopiHoumaHungarianIcelanderIndian (Asian)IndonesianInupiatIranianIraqiIrishIroquoisIsraeliItalianJamaicanJapaneseJordanianKenyanKiowaKoreanLaotianLatvianLebaneseLiberianLithuanianLumbeeLuxembourgerMacedonianMalaysianMalteseMarshalleseMenomineeMexicanMexican American IndianMongolianMoroccanNative HawaiianNavajoNepaleseNew ZealanderNicaraguanNigerianNorthern EuropeanNorwegianOkinawanOsageOttawaPaiutePakistaniPalestinianPanamanianParaguayanPennsylvania GermanPeruvianPimaPolishPortuguesePotawatomiPuebloPuerto RicanPuget Sound SalishRomanianRussianSalvadoranSamoanScandinavianScotch-IrishScottishSeminoleSenegaleseSerbianShoshoneSierra LeoneanSiouxSlavicSlovakSloveneSomaliSouth AfricanSouth AmericanSouth American IndianSoviet UnionSpaniardSpanishSpanish AmericanSpanish American IndianSri LankanSubsaharan AfricanSudaneseSwedishSwissSyrianTaiwaneseThaiTlingit-HaidaTohono O'OdhamTonganTrinidadian and TobagonianTsimshianTurkishU.S. Virgin IslanderUgandanUkrainianUruguayanUteVenezuelanVietnameseWelshWest IndianYakamaYaquiYugoslavianYumanYup'ikZimbabwean
Immigration
NonimmigrantsImmigrantsAfghanistanAfricaAlbaniaArgentinaArmeniaAsiaAustraliaAustriaBahamasBangladeshBarbadosBelarusBelgiumBelizeBoliviaBosnia and HerzegovinaBrazilBulgariaBurma/MyanmarCabo VerdeCambodiaCameroonCanadaCaribbeanCentral AmericaChileChinaColombiaCongoCosta RicaCroatiaCubaCzechoslovakiaDenmarkDominicaDominican RepublicEastern AfricaEastern AsiaEastern EuropeEcuadorEgyptEl SalvadorEnglandEritreaEthiopiaEuropeFijiFranceGermanyGhanaGreeceGrenadaGuatemalaGuyanaHaitiHondurasHong KongHungaryIndiaIndonesiaIranIraqIrelandIsraelItalyJamaicaJapanJordanKazakhstanKenyaKoreaKuwaitLaosLatin AmericaLatviaLebanonLiberiaLithuaniaMalaysiaMexicoMicronesiaMiddle AfricaMoldovaMoroccoNepalNetherlandsNicaraguaNigeriaNorth AmericaNorth MacedoniaNorthern AfricaNorthern EuropeNorwayOceaniaPakistanPanamaPeruPhilippinesPolandPortugalRomaniaRussiaSaudi ArabiaScotlandSenegalSerbiaSierra LeoneSingaporeSomaliaSouth AfricaSouth AmericaSouth Central AsiaSouth Eastern AsiaSouthern EuropeSpainSri LankaSt. Vincent and the GrenadinesSudanSwedenSwitzerlandSyriaTaiwanThailandTrinidad and TobagoTurkeyUgandaUkraineUruguayUzbekistanVenezuelaVietnamWest IndiesWestern AfricaWestern AsiaWestern EuropeYemenZaireZimbabweAzores
1st Grade
Income
Poverty
Unemployment
Labor Participation
Family Structure
Vehicle Availability
Education Level
Disability

1st Grade Comparison

Cubans

Immigrants from Uganda

Tragic
Poor
97.5%
1ST GRADE
0.3/ 100
METRIC RATING
265th/ 347
METRIC RANK
97.8%
1ST GRADE
18.2/ 100
METRIC RATING
204th/ 347
METRIC RANK

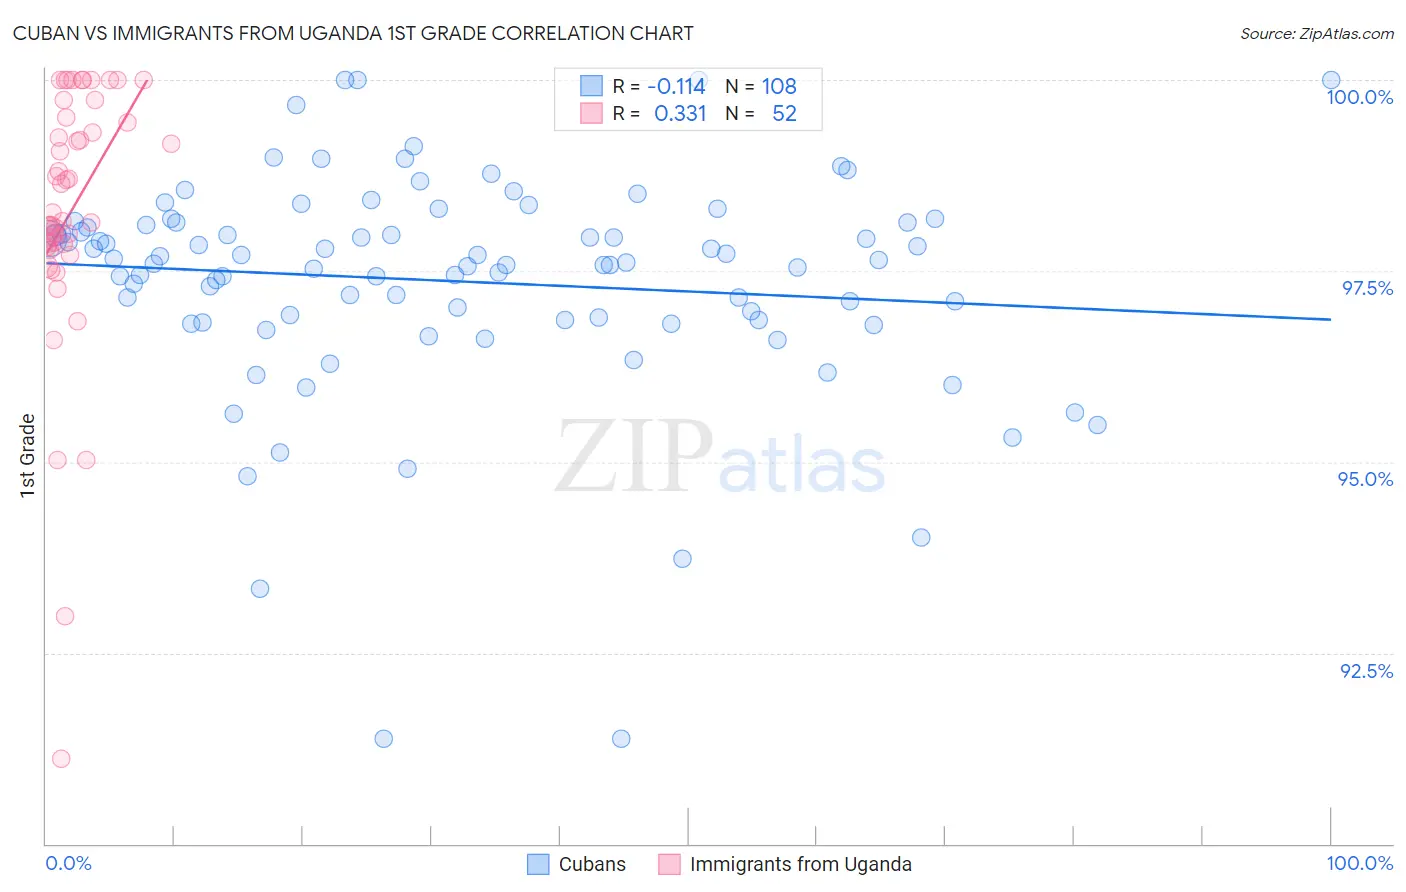
Cuban vs Immigrants from Uganda 1st Grade Correlation Chart

The statistical analysis conducted on geographies consisting of 449,326,865 people shows a poor negative correlation between the proportion of Cubans and percentage of population with at least 1st grade education in the United States with a correlation coefficient (R) of -0.114 and weighted average of 97.5%. Similarly, the statistical analysis conducted on geographies consisting of 125,941,298 people shows a mild positive correlation between the proportion of Immigrants from Uganda and percentage of population with at least 1st grade education in the United States with a correlation coefficient (R) of 0.331 and weighted average of 97.8%, a difference of 0.32%.
Cuban vs Immigrants from Uganda 1st Grade

1st Grade Correlation Summary

MeasurementCubanImmigrants from Uganda
Minimum91.4%91.1%
Maximum100.0%100.0%
Range8.6%8.9%
Mean97.4%98.3%
Median97.6%98.2%
Interquartile 25% (IQ1)96.9%97.8%
Interquartile 75% (IQ3)98.1%99.5%
Interquartile Range (IQR)1.3%1.6%
Standard Deviation (Sample)1.5%1.7%
Standard Deviation (Population)1.5%1.7%

Similar Demographics by 1st Grade

Demographics Similar to Cubans by 1st Grade

In terms of 1st grade, the demographic groups most similar to Cubans are Immigrants from Liberia (97.5%, a difference of 0.0%), Immigrants from Sierra Leone (97.5%, a difference of 0.0%), Immigrants from South America (97.5%, a difference of 0.010%), Taiwanese (97.5%, a difference of 0.010%), and Immigrants from Nigeria (97.5%, a difference of 0.010%).
DemographicsRating | Rank1st Grade
Indians (Asian)
0.6
/100
|
#258
Tragic
97.5%
Fijians
0.5
/100
|
#259
Tragic
97.5%
Armenians
0.5
/100
|
#260
Tragic
97.5%
Immigrants | Ethiopia
0.4
/100
|
#261
Tragic
97.5%
Assyrians/Chaldeans/Syriacs
0.4
/100
|
#262
Tragic
97.5%
Immigrants | South America
0.4
/100
|
#263
Tragic
97.5%
Taiwanese
0.4
/100
|
#264
Tragic
97.5%
Cubans
0.3
/100
|
#265
Tragic
97.5%
Immigrants | Liberia
0.3
/100
|
#266
Tragic
97.5%
Immigrants | Sierra Leone
0.3
/100
|
#267
Tragic
97.5%
Immigrants | Nigeria
0.3
/100
|
#268
Tragic
97.5%
West Indians
0.3
/100
|
#269
Tragic
97.5%
Immigrants | Jamaica
0.2
/100
|
#270
Tragic
97.5%
Immigrants | Cameroon
0.2
/100
|
#271
Tragic
97.4%
Immigrants | Peru
0.2
/100
|
#272
Tragic
97.4%

Demographics Similar to Immigrants from Uganda by 1st Grade

In terms of 1st grade, the demographic groups most similar to Immigrants from Uganda are Immigrants from Southern Europe (97.8%, a difference of 0.0%), Immigrants from Chile (97.8%, a difference of 0.0%), Immigrants from Albania (97.8%, a difference of 0.0%), Immigrants from Lebanon (97.8%, a difference of 0.010%), and Immigrants from Ukraine (97.8%, a difference of 0.010%).
DemographicsRating | Rank1st Grade
Guamanians/Chamorros
26.2
/100
|
#197
Fair
97.8%
Yuman
24.4
/100
|
#198
Fair
97.8%
Tohono O'odham
23.2
/100
|
#199
Fair
97.8%
Immigrants | Egypt
22.6
/100
|
#200
Fair
97.8%
Immigrants | Lebanon
20.1
/100
|
#201
Fair
97.8%
Immigrants | Ukraine
19.2
/100
|
#202
Poor
97.8%
Immigrants | Southern Europe
18.2
/100
|
#203
Poor
97.8%
Immigrants | Uganda
18.2
/100
|
#204
Poor
97.8%
Immigrants | Chile
17.7
/100
|
#205
Poor
97.8%
Immigrants | Albania
17.3
/100
|
#206
Poor
97.8%
Africans
16.5
/100
|
#207
Poor
97.8%
Immigrants | Northern Africa
12.0
/100
|
#208
Poor
97.8%
Costa Ricans
11.6
/100
|
#209
Poor
97.8%
Immigrants | Oceania
11.0
/100
|
#210
Poor
97.8%
Laotians
10.3
/100
|
#211
Poor
97.8%