Cuban vs Inupiat 1st Grade
COMPARE
Cuban
Inupiat
1st Grade
1st Grade Comparison
Cubans
Inupiat
97.5%
1ST GRADE
0.3/ 100
METRIC RATING
265th/ 347
METRIC RANK
98.9%
1ST GRADE
100.0/ 100
METRIC RATING
3rd/ 347
METRIC RANK
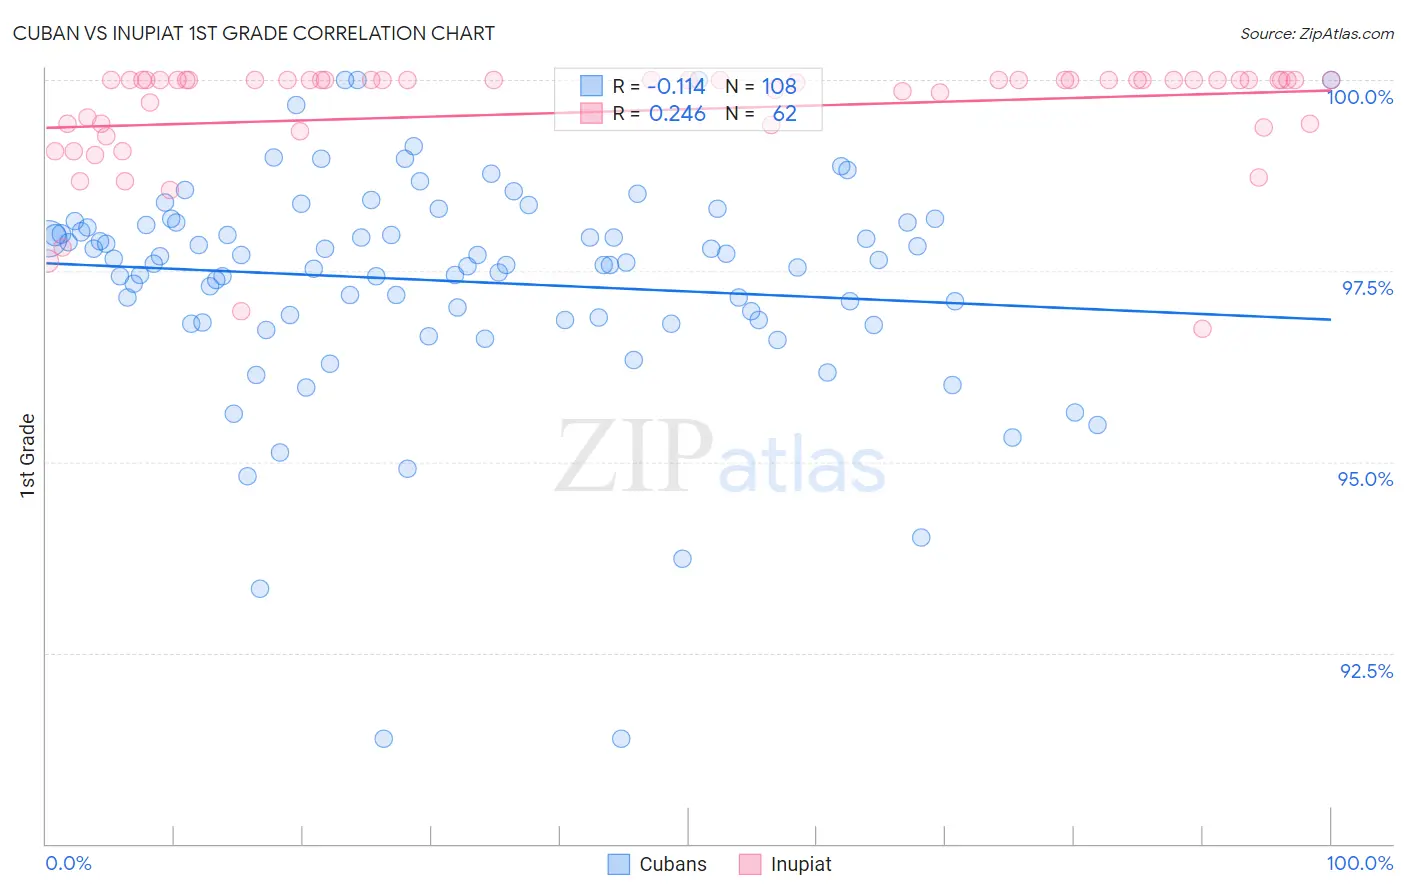
Cuban vs Inupiat 1st Grade Correlation Chart
The statistical analysis conducted on geographies consisting of 449,326,865 people shows a poor negative correlation between the proportion of Cubans and percentage of population with at least 1st grade education in the United States with a correlation coefficient (R) of -0.114 and weighted average of 97.5%. Similarly, the statistical analysis conducted on geographies consisting of 96,348,974 people shows a weak positive correlation between the proportion of Inupiat and percentage of population with at least 1st grade education in the United States with a correlation coefficient (R) of 0.246 and weighted average of 98.9%, a difference of 1.4%.
1st Grade Correlation Summary
| Measurement | Cuban | Inupiat |
| Minimum | 91.4% | 96.7% |
| Maximum | 100.0% | 100.0% |
| Range | 8.6% | 3.3% |
| Mean | 97.4% | 99.6% |
| Median | 97.6% | 100.0% |
| Interquartile 25% (IQ1) | 96.9% | 99.4% |
| Interquartile 75% (IQ3) | 98.1% | 100.0% |
| Interquartile Range (IQR) | 1.3% | 0.59% |
| Standard Deviation (Sample) | 1.5% | 0.74% |
| Standard Deviation (Population) | 1.5% | 0.74% |
Similar Demographics by 1st Grade
Demographics Similar to Cubans by 1st Grade
In terms of 1st grade, the demographic groups most similar to Cubans are Immigrants from Liberia (97.5%, a difference of 0.0%), Immigrants from Sierra Leone (97.5%, a difference of 0.0%), Immigrants from South America (97.5%, a difference of 0.010%), Taiwanese (97.5%, a difference of 0.010%), and Immigrants from Nigeria (97.5%, a difference of 0.010%).
| Demographics | Rating | Rank | 1st Grade |
| Indians (Asian) | 0.6 /100 | #258 | Tragic 97.5% |
| Fijians | 0.5 /100 | #259 | Tragic 97.5% |
| Armenians | 0.5 /100 | #260 | Tragic 97.5% |
| Immigrants | Ethiopia | 0.4 /100 | #261 | Tragic 97.5% |
| Assyrians/Chaldeans/Syriacs | 0.4 /100 | #262 | Tragic 97.5% |
| Immigrants | South America | 0.4 /100 | #263 | Tragic 97.5% |
| Taiwanese | 0.4 /100 | #264 | Tragic 97.5% |
| Cubans | 0.3 /100 | #265 | Tragic 97.5% |
| Immigrants | Liberia | 0.3 /100 | #266 | Tragic 97.5% |
| Immigrants | Sierra Leone | 0.3 /100 | #267 | Tragic 97.5% |
| Immigrants | Nigeria | 0.3 /100 | #268 | Tragic 97.5% |
| West Indians | 0.3 /100 | #269 | Tragic 97.5% |
| Immigrants | Jamaica | 0.2 /100 | #270 | Tragic 97.5% |
| Immigrants | Cameroon | 0.2 /100 | #271 | Tragic 97.4% |
| Immigrants | Peru | 0.2 /100 | #272 | Tragic 97.4% |
Demographics Similar to Inupiat by 1st Grade
In terms of 1st grade, the demographic groups most similar to Inupiat are Welsh (98.9%, a difference of 0.010%), Tsimshian (98.8%, a difference of 0.040%), Alaskan Athabascan (98.8%, a difference of 0.10%), Alaska Native (98.7%, a difference of 0.15%), and Norwegian (98.7%, a difference of 0.17%).
| Demographics | Rating | Rank | 1st Grade |
| Crow | 100.0 /100 | #1 | Exceptional 99.6% |
| Yup'ik | 100.0 /100 | #2 | Exceptional 99.2% |
| Inupiat | 100.0 /100 | #3 | Exceptional 98.9% |
| Welsh | 100.0 /100 | #4 | Exceptional 98.9% |
| Tsimshian | 100.0 /100 | #5 | Exceptional 98.8% |
| Alaskan Athabascans | 100.0 /100 | #6 | Exceptional 98.8% |
| Alaska Natives | 100.0 /100 | #7 | Exceptional 98.7% |
| Norwegians | 100.0 /100 | #8 | Exceptional 98.7% |
| Slovaks | 100.0 /100 | #9 | Exceptional 98.7% |
| Germans | 100.0 /100 | #10 | Exceptional 98.7% |
| Tlingit-Haida | 100.0 /100 | #11 | Exceptional 98.7% |
| Slovenes | 100.0 /100 | #12 | Exceptional 98.7% |
| Carpatho Rusyns | 100.0 /100 | #13 | Exceptional 98.6% |
| English | 100.0 /100 | #14 | Exceptional 98.6% |
| Swedes | 100.0 /100 | #15 | Exceptional 98.6% |