Cuban vs Immigrants from Norway Professional Degree

COMPARE

Cuban
Race
Ancestry
AfghanAfricanAlaska NativeAlaskan AthabascanAlbanianAleutAlsatianAmericanApacheArabArapahoArgentineanArmenianAssyrian/Chaldean/SyriacAustralianAustrianBahamianBangladeshiBarbadianBasqueBelgianBelizeanBermudanBhutaneseBlackfeetBolivianBrazilianBritishBritish West IndianBulgarianBurmeseCajunCambodianCanadianCape VerdeanCarpatho RusynCelticCentral AmericanCentral American IndianCherokeeCheyenneChickasawChileanChineseChippewaChoctawColombianColvilleComancheCosta RicanCreeCreekCroatianCrowCubanCypriotCzechCzechoslovakianDanishDelawareDominicanDutchDutch West IndianEastern EuropeanEcuadorianEgyptianEnglishEstonianEthiopianEuropeanFijianFilipinoFinnishFrenchFrench American IndianFrench CanadianGermanGerman RussianGhanaianGreekGuamanian/ChamorroGuatemalanGuyaneseHaitianHmongHonduranHopiHoumaHungarianIcelanderIndian (Asian)IndonesianInupiatIranianIraqiIrishIroquoisIsraeliItalianJamaicanJapaneseJordanianKenyanKiowaKoreanLaotianLatvianLebaneseLiberianLithuanianLumbeeLuxembourgerMacedonianMalaysianMalteseMarshalleseMenomineeMexicanMexican American IndianMongolianMoroccanNative HawaiianNavajoNepaleseNew ZealanderNicaraguanNigerianNorthern EuropeanNorwegianOkinawanOsageOttawaPaiutePakistaniPalestinianPanamanianParaguayanPennsylvania GermanPeruvianPimaPolishPortuguesePotawatomiPuebloPuerto RicanPuget Sound SalishRomanianRussianSalvadoranSamoanScandinavianScotch-IrishScottishSeminoleSenegaleseSerbianShoshoneSierra LeoneanSiouxSlavicSlovakSloveneSomaliSouth AfricanSouth AmericanSouth American IndianSoviet UnionSpaniardSpanishSpanish AmericanSpanish American IndianSri LankanSubsaharan AfricanSudaneseSwedishSwissSyrianTaiwaneseThaiTlingit-HaidaTohono O'OdhamTonganTrinidadian and TobagonianTsimshianTurkishU.S. Virgin IslanderUgandanUkrainianUruguayanUteVenezuelanVietnameseWelshWest IndianYakamaYaquiYugoslavianYumanYup'ikZimbabwean
Immigration
NonimmigrantsImmigrantsAfghanistanAfricaAlbaniaArgentinaArmeniaAsiaAustraliaAustriaBahamasBangladeshBarbadosBelarusBelgiumBelizeBoliviaBosnia and HerzegovinaBrazilBulgariaBurma/MyanmarCabo VerdeCambodiaCameroonCanadaCaribbeanCentral AmericaChileChinaColombiaCongoCosta RicaCroatiaCubaCzechoslovakiaDenmarkDominicaDominican RepublicEastern AfricaEastern AsiaEastern EuropeEcuadorEgyptEl SalvadorEnglandEritreaEthiopiaEuropeFijiFranceGermanyGhanaGreeceGrenadaGuatemalaGuyanaHaitiHondurasHong KongHungaryIndiaIndonesiaIranIraqIrelandIsraelItalyJamaicaJapanJordanKazakhstanKenyaKoreaKuwaitLaosLatin AmericaLatviaLebanonLiberiaLithuaniaMalaysiaMexicoMicronesiaMiddle AfricaMoldovaMoroccoNepalNetherlandsNicaraguaNigeriaNorth AmericaNorth MacedoniaNorthern AfricaNorthern EuropeOceaniaPakistanPanamaPeruPhilippinesPolandPortugalRomaniaRussiaSaudi ArabiaScotlandSenegalSerbiaSierra LeoneSingaporeSomaliaSouth AfricaSouth AmericaSouth Central AsiaSouth Eastern AsiaSouthern EuropeSpainSri LankaSt. Vincent and the GrenadinesSudanSwedenSwitzerlandSyriaTaiwanThailandTrinidad and TobagoTurkeyUgandaUkraineUruguayUzbekistanVenezuelaVietnamWest IndiesWestern AfricaWestern AsiaWestern EuropeYemenZaireZimbabweAzores
Immigrants from Norway
Race
Ancestry
AfghanAfricanAlaska NativeAlaskan AthabascanAlbanianAleutAlsatianAmericanApacheArabArapahoArgentineanArmenianAssyrian/Chaldean/SyriacAustralianAustrianBahamianBangladeshiBarbadianBasqueBelgianBelizeanBermudanBhutaneseBlackfeetBolivianBrazilianBritishBritish West IndianBulgarianBurmeseCajunCambodianCanadianCape VerdeanCarpatho RusynCelticCentral AmericanCentral American IndianCherokeeCheyenneChickasawChileanChineseChippewaChoctawColombianColvilleComancheCosta RicanCreeCreekCroatianCrowCypriotCzechCzechoslovakianDanishDelawareDominicanDutchDutch West IndianEastern EuropeanEcuadorianEgyptianEnglishEstonianEthiopianEuropeanFijianFilipinoFinnishFrenchFrench American IndianFrench CanadianGermanGerman RussianGhanaianGreekGuamanian/ChamorroGuatemalanGuyaneseHaitianHmongHonduranHopiHoumaHungarianIcelanderIndian (Asian)IndonesianInupiatIranianIraqiIrishIroquoisIsraeliItalianJamaicanJapaneseJordanianKenyanKiowaKoreanLaotianLatvianLebaneseLiberianLithuanianLumbeeLuxembourgerMacedonianMalaysianMalteseMarshalleseMenomineeMexicanMexican American IndianMongolianMoroccanNative HawaiianNavajoNepaleseNew ZealanderNicaraguanNigerianNorthern EuropeanNorwegianOkinawanOsageOttawaPaiutePakistaniPalestinianPanamanianParaguayanPennsylvania GermanPeruvianPimaPolishPortuguesePotawatomiPuebloPuerto RicanPuget Sound SalishRomanianRussianSalvadoranSamoanScandinavianScotch-IrishScottishSeminoleSenegaleseSerbianShoshoneSierra LeoneanSiouxSlavicSlovakSloveneSomaliSouth AfricanSouth AmericanSouth American IndianSoviet UnionSpaniardSpanishSpanish AmericanSpanish American IndianSri LankanSubsaharan AfricanSudaneseSwedishSwissSyrianTaiwaneseThaiTlingit-HaidaTohono O'OdhamTonganTrinidadian and TobagonianTsimshianTurkishU.S. Virgin IslanderUgandanUkrainianUruguayanUteVenezuelanVietnameseWelshWest IndianYakamaYaquiYugoslavianYumanYup'ikZimbabwean
Immigration
NonimmigrantsImmigrantsAfghanistanAfricaAlbaniaArgentinaArmeniaAsiaAustraliaAustriaBahamasBangladeshBarbadosBelarusBelgiumBelizeBoliviaBosnia and HerzegovinaBrazilBulgariaBurma/MyanmarCabo VerdeCambodiaCameroonCanadaCaribbeanCentral AmericaChileChinaColombiaCongoCosta RicaCroatiaCubaCzechoslovakiaDenmarkDominicaDominican RepublicEastern AfricaEastern AsiaEastern EuropeEcuadorEgyptEl SalvadorEnglandEritreaEthiopiaEuropeFijiFranceGermanyGhanaGreeceGrenadaGuatemalaGuyanaHaitiHondurasHong KongHungaryIndiaIndonesiaIranIraqIrelandIsraelItalyJamaicaJapanJordanKazakhstanKenyaKoreaKuwaitLaosLatin AmericaLatviaLebanonLiberiaLithuaniaMalaysiaMexicoMicronesiaMiddle AfricaMoldovaMoroccoNepalNetherlandsNicaraguaNigeriaNorth AmericaNorth MacedoniaNorthern AfricaNorthern EuropeNorwayOceaniaPakistanPanamaPeruPhilippinesPolandPortugalRomaniaRussiaSaudi ArabiaScotlandSenegalSerbiaSierra LeoneSingaporeSomaliaSouth AfricaSouth AmericaSouth Central AsiaSouth Eastern AsiaSouthern EuropeSpainSri LankaSt. Vincent and the GrenadinesSudanSwedenSwitzerlandSyriaTaiwanThailandTrinidad and TobagoTurkeyUgandaUkraineUruguayUzbekistanVenezuelaVietnamWest IndiesWestern AfricaWestern AsiaWestern EuropeYemenZaireZimbabweAzores
Professional Degree
Income
Poverty
Unemployment
Labor Participation
Family Structure
Vehicle Availability
Education Level
Disability

Professional Degree Comparison

Cubans

Immigrants from Norway

Tragic
Exceptional
4.0%
PROFESSIONAL DEGREE
5.9/ 100
METRIC RATING
227th/ 347
METRIC RANK
6.0%
PROFESSIONAL DEGREE
100.0/ 100
METRIC RATING
38th/ 347
METRIC RANK

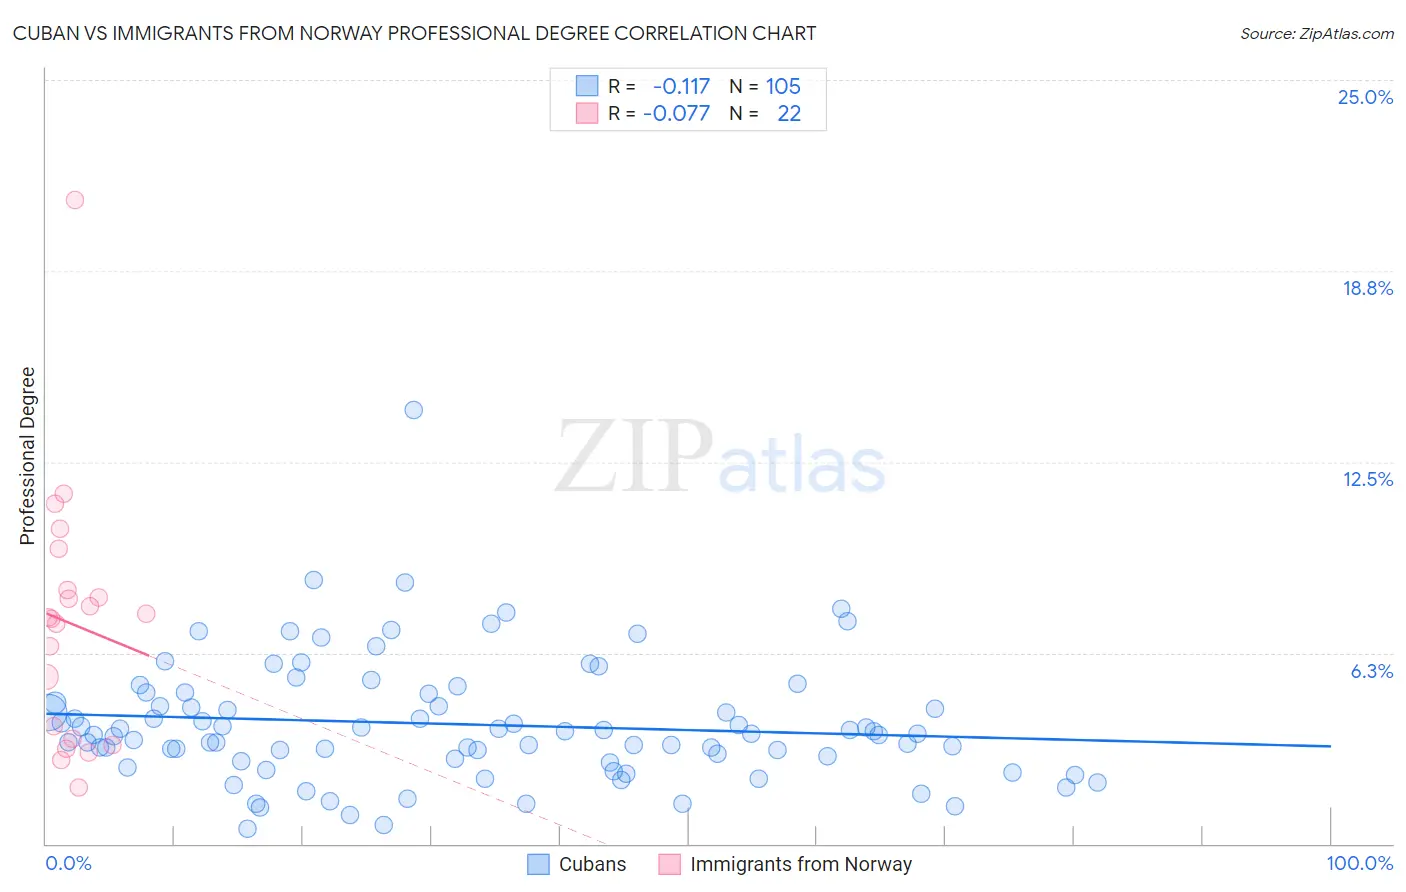
Cuban vs Immigrants from Norway Professional Degree Correlation Chart

The statistical analysis conducted on geographies consisting of 447,765,815 people shows a poor negative correlation between the proportion of Cubans and percentage of population with at least professional degree education in the United States with a correlation coefficient (R) of -0.117 and weighted average of 4.0%. Similarly, the statistical analysis conducted on geographies consisting of 116,643,848 people shows a slight negative correlation between the proportion of Immigrants from Norway and percentage of population with at least professional degree education in the United States with a correlation coefficient (R) of -0.077 and weighted average of 6.0%, a difference of 51.6%.
Cuban vs Immigrants from Norway Professional Degree

Professional Degree Correlation Summary

MeasurementCubanImmigrants from Norway
Minimum0.48%1.9%
Maximum14.2%21.1%
Range13.7%19.2%
Mean3.9%7.2%
Median3.6%7.4%
Interquartile 25% (IQ1)2.7%3.4%
Interquartile 75% (IQ3)4.8%8.3%
Interquartile Range (IQR)2.0%4.9%
Standard Deviation (Sample)2.0%4.2%
Standard Deviation (Population)2.0%4.1%

Similar Demographics by Professional Degree

Demographics Similar to Cubans by Professional Degree

In terms of professional degree, the demographic groups most similar to Cubans are German Russian (4.0%, a difference of 0.12%), Immigrants from West Indies (4.0%, a difference of 0.25%), Immigrants from Burma/Myanmar (3.9%, a difference of 0.39%), Nicaraguan (3.9%, a difference of 0.67%), and Tlingit-Haida (4.0%, a difference of 0.68%).
DemographicsRating | RankProfessional Degree
Ute
8.2
/100
|
#220
Tragic
4.0%
French Canadians
8.0
/100
|
#221
Tragic
4.0%
Immigrants | Western Africa
7.5
/100
|
#222
Tragic
4.0%
Immigrants | Bosnia and Herzegovina
7.4
/100
|
#223
Tragic
4.0%
Trinidadians and Tobagonians
7.1
/100
|
#224
Tragic
4.0%
Tlingit-Haida
6.9
/100
|
#225
Tragic
4.0%
German Russians
6.1
/100
|
#226
Tragic
4.0%
Cubans
5.9
/100
|
#227
Tragic
4.0%
Immigrants | West Indies
5.6
/100
|
#228
Tragic
4.0%
Immigrants | Burma/Myanmar
5.4
/100
|
#229
Tragic
3.9%
Nicaraguans
5.1
/100
|
#230
Tragic
3.9%
Ecuadorians
4.6
/100
|
#231
Tragic
3.9%
Cree
4.3
/100
|
#232
Tragic
3.9%
Immigrants | Philippines
4.1
/100
|
#233
Tragic
3.9%
Immigrants | Nonimmigrants
4.0
/100
|
#234
Tragic
3.9%

Demographics Similar to Immigrants from Norway by Professional Degree

In terms of professional degree, the demographic groups most similar to Immigrants from Norway are Immigrants from Austria (6.0%, a difference of 0.20%), Immigrants from South Africa (6.0%, a difference of 0.25%), Immigrants from Russia (6.0%, a difference of 0.51%), Cambodian (6.0%, a difference of 0.73%), and New Zealander (6.0%, a difference of 0.91%).
DemographicsRating | RankProfessional Degree
Immigrants | India
100.0
/100
|
#31
Exceptional
6.2%
Thais
100.0
/100
|
#32
Exceptional
6.1%
Burmese
100.0
/100
|
#33
Exceptional
6.1%
Mongolians
100.0
/100
|
#34
Exceptional
6.1%
Immigrants | Korea
100.0
/100
|
#35
Exceptional
6.1%
Immigrants | Russia
100.0
/100
|
#36
Exceptional
6.0%
Immigrants | Austria
100.0
/100
|
#37
Exceptional
6.0%
Immigrants | Norway
100.0
/100
|
#38
Exceptional
6.0%
Immigrants | South Africa
100.0
/100
|
#39
Exceptional
6.0%
Cambodians
100.0
/100
|
#40
Exceptional
6.0%
New Zealanders
100.0
/100
|
#41
Exceptional
6.0%
Estonians
100.0
/100
|
#42
Exceptional
6.0%
Immigrants | Saudi Arabia
100.0
/100
|
#43
Exceptional
5.9%
Argentineans
100.0
/100
|
#44
Exceptional
5.9%
Immigrants | South Central Asia
100.0
/100
|
#45
Exceptional
5.9%