Cuban vs Swedish Professional Degree
COMPARE
Cuban
Swedish
Professional Degree
Professional Degree Comparison
Cubans
Swedes
4.0%
PROFESSIONAL DEGREE
5.9/ 100
METRIC RATING
227th/ 347
METRIC RANK
4.5%
PROFESSIONAL DEGREE
69.9/ 100
METRIC RATING
156th/ 347
METRIC RANK
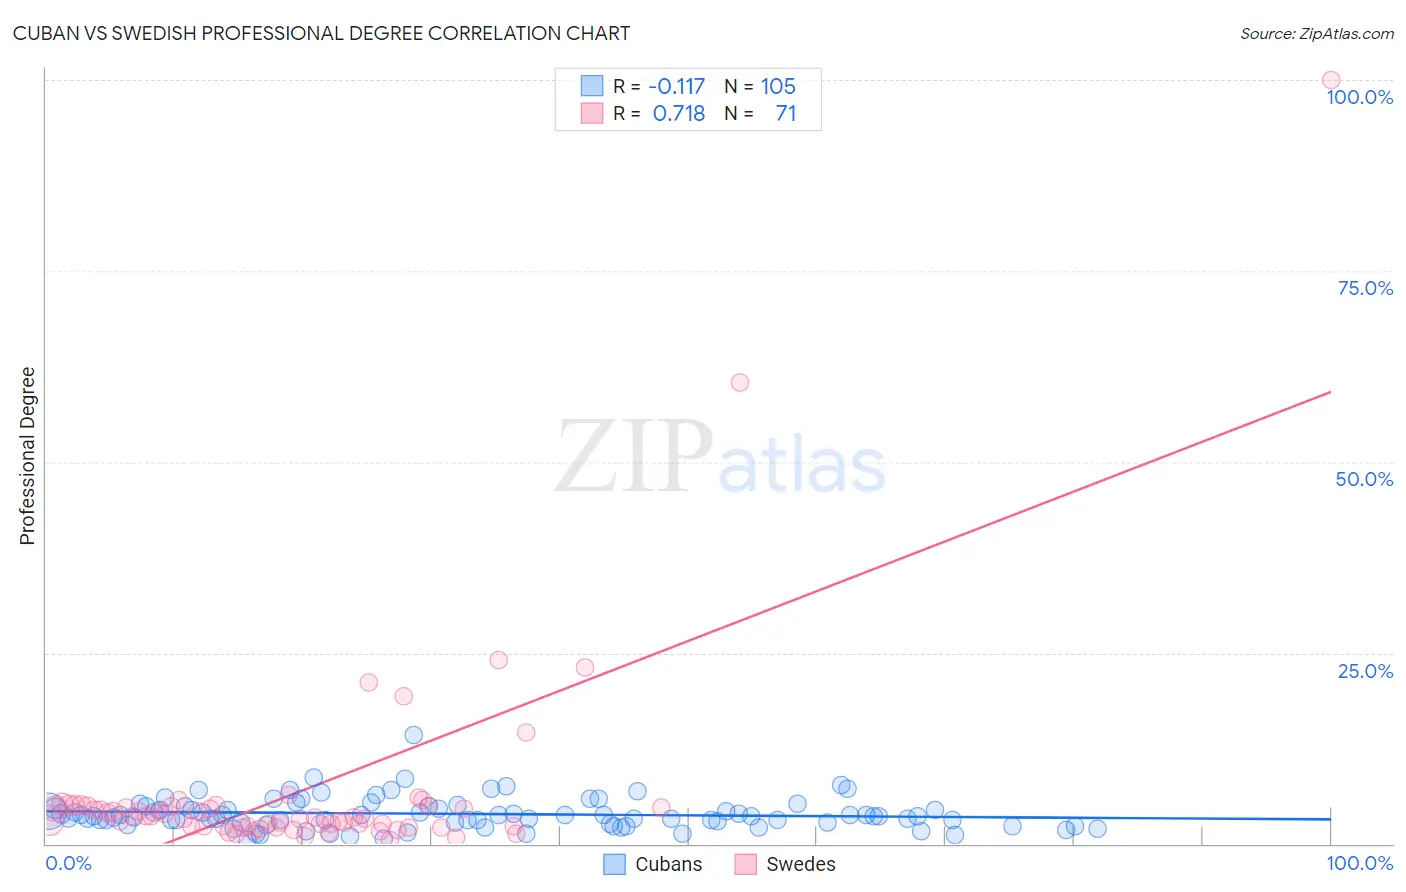
Cuban vs Swedish Professional Degree Correlation Chart
The statistical analysis conducted on geographies consisting of 447,765,815 people shows a poor negative correlation between the proportion of Cubans and percentage of population with at least professional degree education in the United States with a correlation coefficient (R) of -0.117 and weighted average of 4.0%. Similarly, the statistical analysis conducted on geographies consisting of 533,979,460 people shows a strong positive correlation between the proportion of Swedes and percentage of population with at least professional degree education in the United States with a correlation coefficient (R) of 0.718 and weighted average of 4.5%, a difference of 14.6%.
Professional Degree Correlation Summary
| Measurement | Cuban | Swedish |
| Minimum | 0.48% | 0.57% |
| Maximum | 14.2% | 100.0% |
| Range | 13.7% | 99.4% |
| Mean | 3.9% | 6.7% |
| Median | 3.6% | 3.5% |
| Interquartile 25% (IQ1) | 2.7% | 2.3% |
| Interquartile 75% (IQ3) | 4.8% | 5.0% |
| Interquartile Range (IQR) | 2.0% | 2.7% |
| Standard Deviation (Sample) | 2.0% | 13.9% |
| Standard Deviation (Population) | 2.0% | 13.8% |
Similar Demographics by Professional Degree
Demographics Similar to Cubans by Professional Degree
In terms of professional degree, the demographic groups most similar to Cubans are German Russian (4.0%, a difference of 0.12%), Immigrants from West Indies (4.0%, a difference of 0.25%), Immigrants from Burma/Myanmar (3.9%, a difference of 0.39%), Nicaraguan (3.9%, a difference of 0.67%), and Tlingit-Haida (4.0%, a difference of 0.68%).
| Demographics | Rating | Rank | Professional Degree |
| Ute | 8.2 /100 | #220 | Tragic 4.0% |
| French Canadians | 8.0 /100 | #221 | Tragic 4.0% |
| Immigrants | Western Africa | 7.5 /100 | #222 | Tragic 4.0% |
| Immigrants | Bosnia and Herzegovina | 7.4 /100 | #223 | Tragic 4.0% |
| Trinidadians and Tobagonians | 7.1 /100 | #224 | Tragic 4.0% |
| Tlingit-Haida | 6.9 /100 | #225 | Tragic 4.0% |
| German Russians | 6.1 /100 | #226 | Tragic 4.0% |
| Cubans | 5.9 /100 | #227 | Tragic 4.0% |
| Immigrants | West Indies | 5.6 /100 | #228 | Tragic 4.0% |
| Immigrants | Burma/Myanmar | 5.4 /100 | #229 | Tragic 3.9% |
| Nicaraguans | 5.1 /100 | #230 | Tragic 3.9% |
| Ecuadorians | 4.6 /100 | #231 | Tragic 3.9% |
| Cree | 4.3 /100 | #232 | Tragic 3.9% |
| Immigrants | Philippines | 4.1 /100 | #233 | Tragic 3.9% |
| Immigrants | Nonimmigrants | 4.0 /100 | #234 | Tragic 3.9% |
Demographics Similar to Swedes by Professional Degree
In terms of professional degree, the demographic groups most similar to Swedes are Iraqi (4.5%, a difference of 0.010%), Slavic (4.5%, a difference of 0.15%), Immigrants from Armenia (4.5%, a difference of 0.18%), Vietnamese (4.5%, a difference of 0.26%), and Immigrants from Senegal (4.5%, a difference of 0.32%).
| Demographics | Rating | Rank | Professional Degree |
| Senegalese | 75.3 /100 | #149 | Good 4.6% |
| Immigrants | Oceania | 73.4 /100 | #150 | Good 4.6% |
| Poles | 72.6 /100 | #151 | Good 4.6% |
| Immigrants | Africa | 72.5 /100 | #152 | Good 4.6% |
| Immigrants | Uruguay | 72.5 /100 | #153 | Good 4.6% |
| Scottish | 71.8 /100 | #154 | Good 4.6% |
| Slavs | 70.8 /100 | #155 | Good 4.5% |
| Swedes | 69.9 /100 | #156 | Good 4.5% |
| Iraqis | 69.8 /100 | #157 | Good 4.5% |
| Immigrants | Armenia | 68.8 /100 | #158 | Good 4.5% |
| Vietnamese | 68.4 /100 | #159 | Good 4.5% |
| Immigrants | Senegal | 68.0 /100 | #160 | Good 4.5% |
| Assyrians/Chaldeans/Syriacs | 67.4 /100 | #161 | Good 4.5% |
| Peruvians | 65.2 /100 | #162 | Good 4.5% |
| Sierra Leoneans | 64.3 /100 | #163 | Good 4.5% |