Cuban vs Immigrants from Western Europe College, 1 year or more
COMPARE
Cuban
Immigrants from Western Europe
College, 1 year or more
College, 1 year or more Comparison
Cubans
Immigrants from Western Europe
53.4%
COLLEGE, 1 YEAR OR MORE
0.0/ 100
METRIC RATING
291st/ 347
METRIC RANK
62.7%
COLLEGE, 1 YEAR OR MORE
98.6/ 100
METRIC RATING
86th/ 347
METRIC RANK
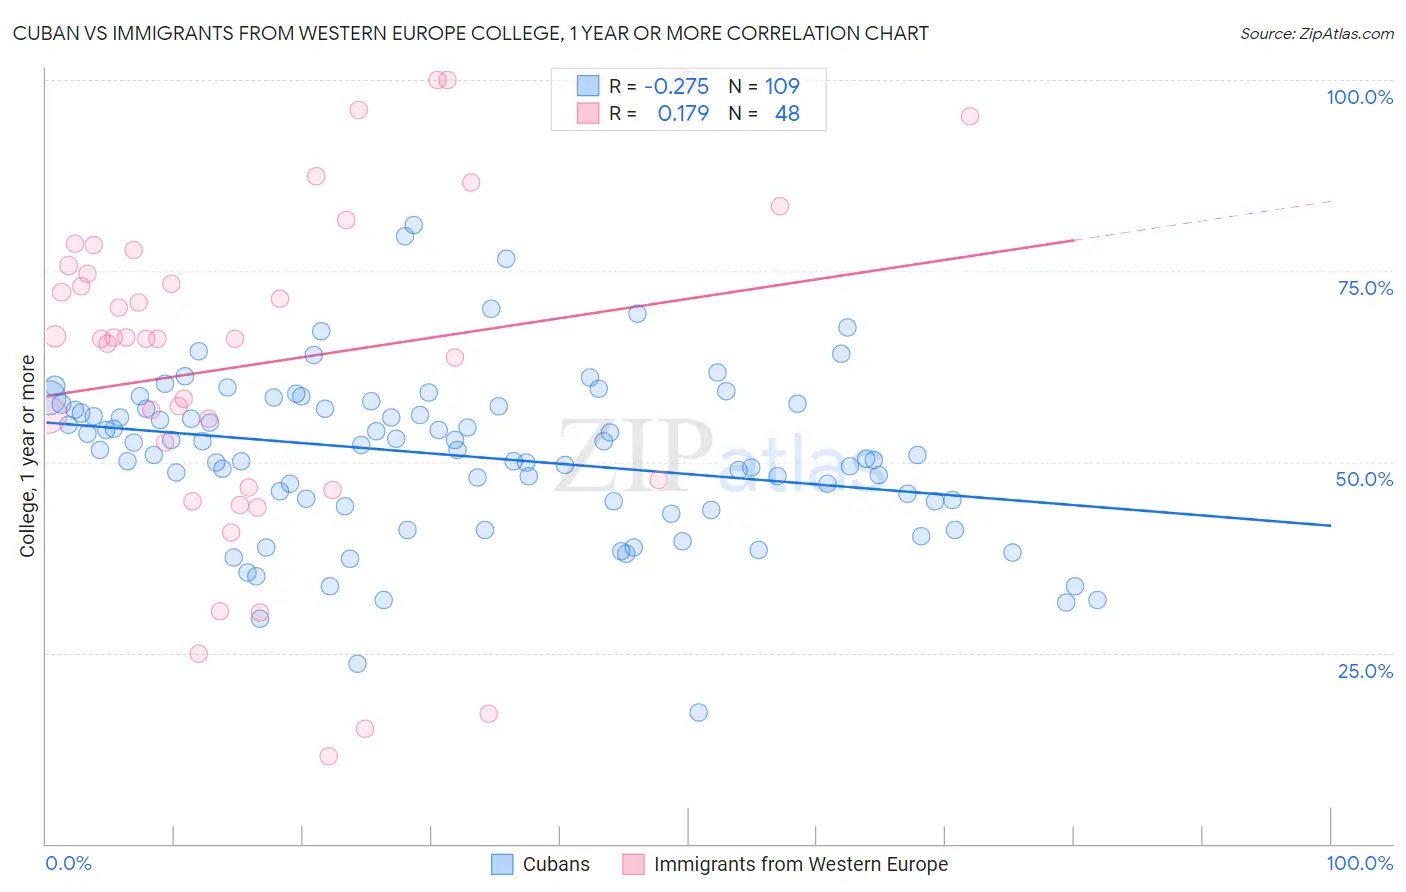
Cuban vs Immigrants from Western Europe College, 1 year or more Correlation Chart
The statistical analysis conducted on geographies consisting of 449,372,622 people shows a weak negative correlation between the proportion of Cubans and percentage of population with at least college, 1 year or more education in the United States with a correlation coefficient (R) of -0.275 and weighted average of 53.4%. Similarly, the statistical analysis conducted on geographies consisting of 494,075,353 people shows a poor positive correlation between the proportion of Immigrants from Western Europe and percentage of population with at least college, 1 year or more education in the United States with a correlation coefficient (R) of 0.179 and weighted average of 62.7%, a difference of 17.5%.
College, 1 year or more Correlation Summary
| Measurement | Cuban | Immigrants from Western Europe |
| Minimum | 17.3% | 11.4% |
| Maximum | 81.0% | 100.0% |
| Range | 63.7% | 88.6% |
| Mean | 50.8% | 62.9% |
| Median | 51.5% | 66.2% |
| Interquartile 25% (IQ1) | 44.8% | 47.2% |
| Interquartile 75% (IQ3) | 57.4% | 76.8% |
| Interquartile Range (IQR) | 12.6% | 29.6% |
| Standard Deviation (Sample) | 10.8% | 22.1% |
| Standard Deviation (Population) | 10.8% | 21.9% |
Similar Demographics by College, 1 year or more
Demographics Similar to Cubans by College, 1 year or more
In terms of college, 1 year or more, the demographic groups most similar to Cubans are Alaskan Athabascan (53.4%, a difference of 0.050%), Alaska Native (53.4%, a difference of 0.070%), Immigrants from Ecuador (53.4%, a difference of 0.070%), Chickasaw (53.3%, a difference of 0.13%), and Black/African American (53.3%, a difference of 0.15%).
| Demographics | Rating | Rank | College, 1 year or more |
| Ute | 0.1 /100 | #284 | Tragic 53.8% |
| Immigrants | Guyana | 0.1 /100 | #285 | Tragic 53.5% |
| Central American Indians | 0.1 /100 | #286 | Tragic 53.5% |
| Immigrants | Belize | 0.1 /100 | #287 | Tragic 53.5% |
| Alaska Natives | 0.0 /100 | #288 | Tragic 53.4% |
| Immigrants | Ecuador | 0.0 /100 | #289 | Tragic 53.4% |
| Alaskan Athabascans | 0.0 /100 | #290 | Tragic 53.4% |
| Cubans | 0.0 /100 | #291 | Tragic 53.4% |
| Chickasaw | 0.0 /100 | #292 | Tragic 53.3% |
| Blacks/African Americans | 0.0 /100 | #293 | Tragic 53.3% |
| Cherokee | 0.0 /100 | #294 | Tragic 53.2% |
| Yaqui | 0.0 /100 | #295 | Tragic 53.2% |
| Sioux | 0.0 /100 | #296 | Tragic 53.0% |
| Paiute | 0.0 /100 | #297 | Tragic 52.9% |
| Immigrants | Dominica | 0.0 /100 | #298 | Tragic 52.5% |
Demographics Similar to Immigrants from Western Europe by College, 1 year or more
In terms of college, 1 year or more, the demographic groups most similar to Immigrants from Western Europe are Immigrants from Pakistan (62.8%, a difference of 0.020%), Immigrants from Hungary (62.7%, a difference of 0.020%), Immigrants from England (62.8%, a difference of 0.030%), Immigrants from Argentina (62.8%, a difference of 0.060%), and Immigrants from Bolivia (62.8%, a difference of 0.10%).
| Demographics | Rating | Rank | College, 1 year or more |
| Northern Europeans | 98.8 /100 | #79 | Exceptional 62.9% |
| Lithuanians | 98.8 /100 | #80 | Exceptional 62.9% |
| Laotians | 98.7 /100 | #81 | Exceptional 62.8% |
| Immigrants | Bolivia | 98.7 /100 | #82 | Exceptional 62.8% |
| Immigrants | Argentina | 98.6 /100 | #83 | Exceptional 62.8% |
| Immigrants | England | 98.6 /100 | #84 | Exceptional 62.8% |
| Immigrants | Pakistan | 98.6 /100 | #85 | Exceptional 62.8% |
| Immigrants | Western Europe | 98.6 /100 | #86 | Exceptional 62.7% |
| Immigrants | Hungary | 98.6 /100 | #87 | Exceptional 62.7% |
| Greeks | 98.3 /100 | #88 | Exceptional 62.6% |
| Immigrants | Ethiopia | 98.2 /100 | #89 | Exceptional 62.6% |
| Immigrants | Western Asia | 97.9 /100 | #90 | Exceptional 62.5% |
| Immigrants | Eastern Europe | 97.8 /100 | #91 | Exceptional 62.4% |
| Immigrants | Egypt | 97.8 /100 | #92 | Exceptional 62.4% |
| Romanians | 97.7 /100 | #93 | Exceptional 62.4% |