Cuban vs Delaware High School Diploma
COMPARE
Cuban
Delaware
High School Diploma
High School Diploma Comparison
Cubans
Delaware
85.4%
HIGH SCHOOL DIPLOMA
0.0/ 100
METRIC RATING
303rd/ 347
METRIC RANK
89.2%
HIGH SCHOOL DIPLOMA
55.8/ 100
METRIC RATING
168th/ 347
METRIC RANK
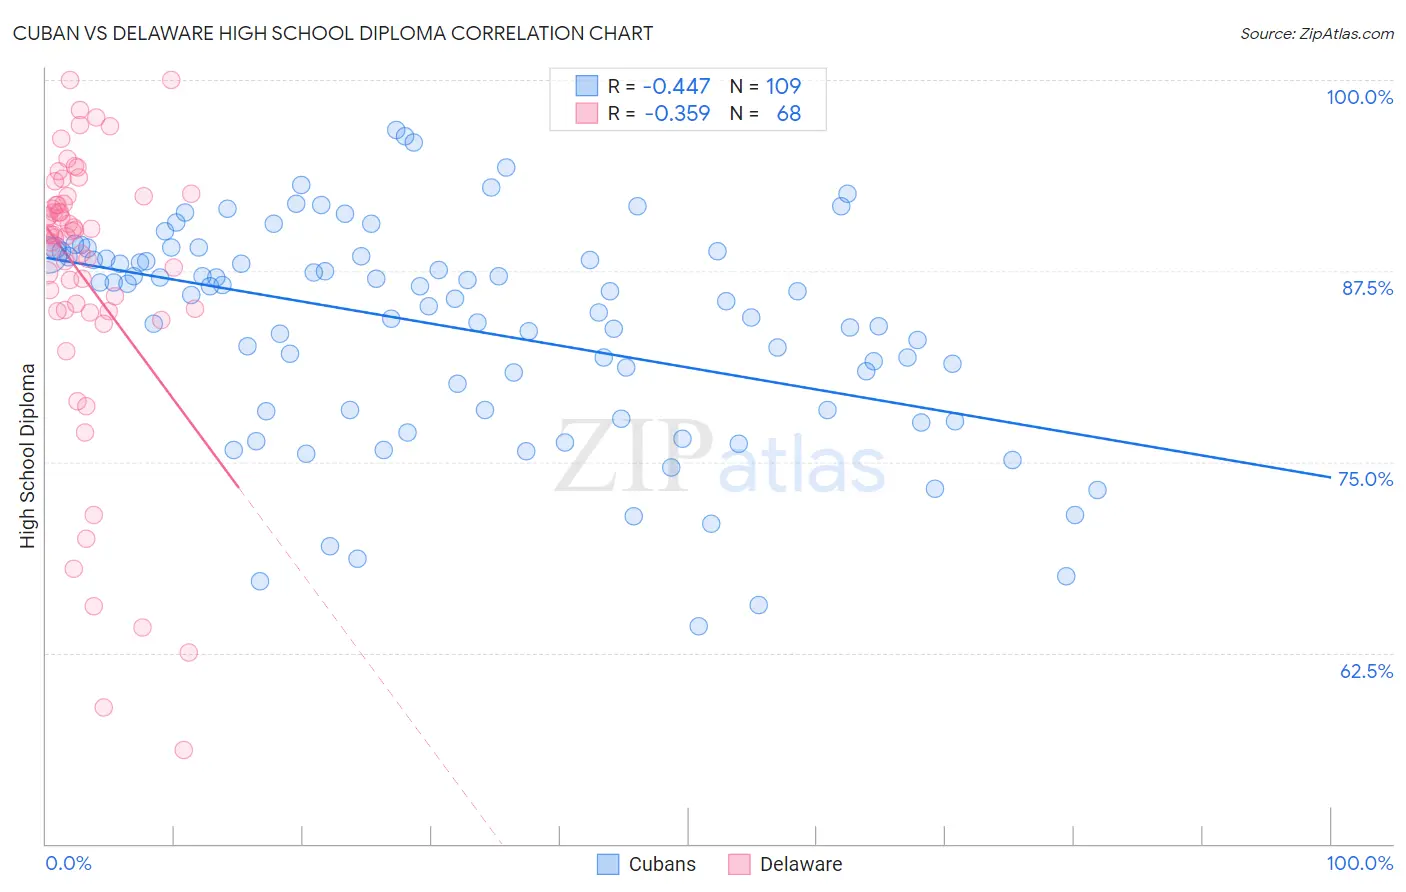
Cuban vs Delaware High School Diploma Correlation Chart
The statistical analysis conducted on geographies consisting of 449,373,028 people shows a moderate negative correlation between the proportion of Cubans and percentage of population with at least high school diploma education in the United States with a correlation coefficient (R) of -0.447 and weighted average of 85.4%. Similarly, the statistical analysis conducted on geographies consisting of 96,235,398 people shows a mild negative correlation between the proportion of Delaware and percentage of population with at least high school diploma education in the United States with a correlation coefficient (R) of -0.359 and weighted average of 89.2%, a difference of 4.5%.
High School Diploma Correlation Summary
| Measurement | Cuban | Delaware |
| Minimum | 64.2% | 56.1% |
| Maximum | 96.7% | 100.0% |
| Range | 32.5% | 43.9% |
| Mean | 83.8% | 86.9% |
| Median | 85.9% | 89.9% |
| Interquartile 25% (IQ1) | 78.4% | 84.9% |
| Interquartile 75% (IQ3) | 88.5% | 92.2% |
| Interquartile Range (IQR) | 10.1% | 7.2% |
| Standard Deviation (Sample) | 7.1% | 9.5% |
| Standard Deviation (Population) | 7.0% | 9.5% |
Similar Demographics by High School Diploma
Demographics Similar to Cubans by High School Diploma
In terms of high school diploma, the demographic groups most similar to Cubans are Immigrants from Haiti (85.4%, a difference of 0.0%), Vietnamese (85.4%, a difference of 0.040%), Immigrants from Bangladesh (85.5%, a difference of 0.060%), Guyanese (85.5%, a difference of 0.080%), and Nepalese (85.3%, a difference of 0.11%).
| Demographics | Rating | Rank | High School Diploma |
| Immigrants | Cambodia | 0.0 /100 | #296 | Tragic 85.6% |
| Immigrants | Grenada | 0.0 /100 | #297 | Tragic 85.6% |
| Natives/Alaskans | 0.0 /100 | #298 | Tragic 85.6% |
| Guyanese | 0.0 /100 | #299 | Tragic 85.5% |
| Immigrants | Bangladesh | 0.0 /100 | #300 | Tragic 85.5% |
| Vietnamese | 0.0 /100 | #301 | Tragic 85.4% |
| Immigrants | Haiti | 0.0 /100 | #302 | Tragic 85.4% |
| Cubans | 0.0 /100 | #303 | Tragic 85.4% |
| Nepalese | 0.0 /100 | #304 | Tragic 85.3% |
| Immigrants | Portugal | 0.0 /100 | #305 | Tragic 85.3% |
| Immigrants | Guyana | 0.0 /100 | #306 | Tragic 85.3% |
| Navajo | 0.0 /100 | #307 | Tragic 85.2% |
| Immigrants | Armenia | 0.0 /100 | #308 | Tragic 85.2% |
| Immigrants | Dominica | 0.0 /100 | #309 | Tragic 85.2% |
| Apache | 0.0 /100 | #310 | Tragic 85.1% |
Demographics Similar to Delaware by High School Diploma
In terms of high school diploma, the demographic groups most similar to Delaware are Iroquois (89.2%, a difference of 0.010%), Immigrants from Hong Kong (89.3%, a difference of 0.040%), Immigrants from Morocco (89.2%, a difference of 0.040%), Spanish (89.2%, a difference of 0.040%), and Immigrants from Asia (89.3%, a difference of 0.060%).
| Demographics | Rating | Rank | High School Diploma |
| Brazilians | 61.2 /100 | #161 | Good 89.3% |
| Bermudans | 61.1 /100 | #162 | Good 89.3% |
| Cree | 61.1 /100 | #163 | Good 89.3% |
| Immigrants | Nepal | 61.1 /100 | #164 | Good 89.3% |
| Immigrants | Asia | 59.8 /100 | #165 | Average 89.3% |
| Immigrants | Albania | 59.4 /100 | #166 | Average 89.3% |
| Immigrants | Hong Kong | 58.6 /100 | #167 | Average 89.3% |
| Delaware | 55.8 /100 | #168 | Average 89.2% |
| Iroquois | 55.1 /100 | #169 | Average 89.2% |
| Immigrants | Morocco | 53.3 /100 | #170 | Average 89.2% |
| Spanish | 52.9 /100 | #171 | Average 89.2% |
| Immigrants | Nonimmigrants | 51.8 /100 | #172 | Average 89.2% |
| Immigrants | Indonesia | 50.3 /100 | #173 | Average 89.1% |
| Hmong | 50.0 /100 | #174 | Average 89.1% |
| Immigrants | Western Asia | 49.0 /100 | #175 | Average 89.1% |