Yup'ik vs Yakama No Schooling Completed
COMPARE
Yup'ik
Yakama
No Schooling Completed
No Schooling Completed Comparison
Yup'ik
Yakama
1.2%
NO SCHOOLING COMPLETED
100.0/ 100
METRIC RATING
1st/ 347
METRIC RANK
3.6%
NO SCHOOLING COMPLETED
0.0/ 100
METRIC RATING
339th/ 347
METRIC RANK
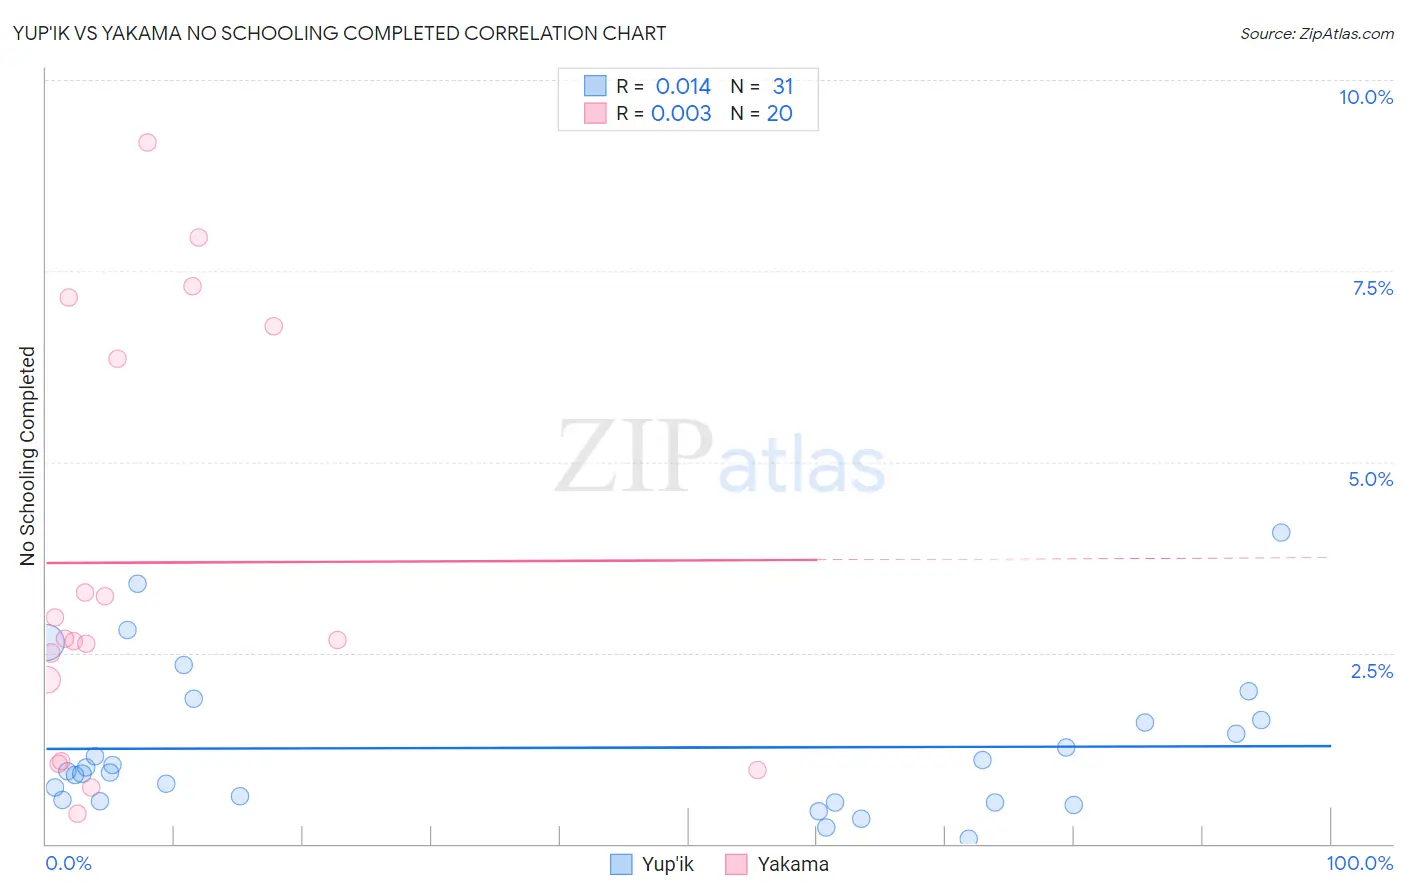
Yup'ik vs Yakama No Schooling Completed Correlation Chart
The statistical analysis conducted on geographies consisting of 39,712,568 people shows no correlation between the proportion of Yup'ik and percentage of population with no schooling in the United States with a correlation coefficient (R) of 0.014 and weighted average of 1.2%. Similarly, the statistical analysis conducted on geographies consisting of 19,822,084 people shows no correlation between the proportion of Yakama and percentage of population with no schooling in the United States with a correlation coefficient (R) of 0.003 and weighted average of 3.6%, a difference of 188.8%.
No Schooling Completed Correlation Summary
| Measurement | Yup'ik | Yakama |
| Minimum | 0.071% | 0.39% |
| Maximum | 4.1% | 9.2% |
| Range | 4.0% | 8.8% |
| Mean | 1.3% | 3.7% |
| Median | 0.95% | 2.7% |
| Interquartile 25% (IQ1) | 0.55% | 1.6% |
| Interquartile 75% (IQ3) | 1.6% | 6.6% |
| Interquartile Range (IQR) | 1.1% | 4.9% |
| Standard Deviation (Sample) | 0.95% | 2.7% |
| Standard Deviation (Population) | 0.94% | 2.6% |
Similar Demographics by No Schooling Completed
Demographics Similar to Yup'ik by No Schooling Completed
In terms of no schooling completed, the demographic groups most similar to Yup'ik are Slovak (1.3%, a difference of 9.1%), Norwegian (1.3%, a difference of 9.6%), German (1.4%, a difference of 10.2%), Slovene (1.4%, a difference of 10.7%), and Carpatho Rusyn (1.4%, a difference of 11.6%).
| Demographics | Rating | Rank | No Schooling Completed |
| Yup'ik | 100.0 /100 | #1 | Exceptional 1.2% |
| Slovaks | 100.0 /100 | #2 | Exceptional 1.3% |
| Norwegians | 100.0 /100 | #3 | Exceptional 1.3% |
| Germans | 100.0 /100 | #4 | Exceptional 1.4% |
| Slovenes | 100.0 /100 | #5 | Exceptional 1.4% |
| Carpatho Rusyns | 100.0 /100 | #6 | Exceptional 1.4% |
| English | 100.0 /100 | #7 | Exceptional 1.4% |
| Swedes | 100.0 /100 | #8 | Exceptional 1.4% |
| Scottish | 100.0 /100 | #9 | Exceptional 1.4% |
| Dutch | 100.0 /100 | #10 | Exceptional 1.4% |
| Lithuanians | 100.0 /100 | #11 | Exceptional 1.4% |
| Irish | 100.0 /100 | #12 | Exceptional 1.4% |
| Poles | 100.0 /100 | #13 | Exceptional 1.4% |
| Scotch-Irish | 100.0 /100 | #14 | Exceptional 1.5% |
| Tlingit-Haida | 100.0 /100 | #15 | Exceptional 1.5% |
Demographics Similar to Yakama by No Schooling Completed
In terms of no schooling completed, the demographic groups most similar to Yakama are Bangladeshi (3.5%, a difference of 0.31%), Immigrants from Cabo Verde (3.5%, a difference of 0.55%), Immigrants from Guatemala (3.6%, a difference of 0.68%), Immigrants from Fiji (3.5%, a difference of 1.3%), and Immigrants from Cambodia (3.5%, a difference of 1.6%).
| Demographics | Rating | Rank | No Schooling Completed |
| Central Americans | 0.0 /100 | #332 | Tragic 3.4% |
| Immigrants | Dominican Republic | 0.0 /100 | #333 | Tragic 3.4% |
| Guatemalans | 0.0 /100 | #334 | Tragic 3.5% |
| Immigrants | Cambodia | 0.0 /100 | #335 | Tragic 3.5% |
| Immigrants | Fiji | 0.0 /100 | #336 | Tragic 3.5% |
| Immigrants | Cabo Verde | 0.0 /100 | #337 | Tragic 3.5% |
| Bangladeshis | 0.0 /100 | #338 | Tragic 3.5% |
| Yakama | 0.0 /100 | #339 | Tragic 3.6% |
| Immigrants | Guatemala | 0.0 /100 | #340 | Tragic 3.6% |
| Immigrants | Central America | 0.0 /100 | #341 | Tragic 3.6% |
| Immigrants | Mexico | 0.0 /100 | #342 | Tragic 3.6% |
| Salvadorans | 0.0 /100 | #343 | Tragic 3.7% |
| Nepalese | 0.0 /100 | #344 | Tragic 3.8% |
| Immigrants | El Salvador | 0.0 /100 | #345 | Tragic 3.9% |
| Immigrants | Yemen | 0.0 /100 | #346 | Tragic 4.1% |