Immigrants from Brazil vs Mongolian College, 1 year or more
COMPARE
Immigrants from Brazil
Mongolian
College, 1 year or more
College, 1 year or more Comparison
Immigrants from Brazil
Mongolians
61.6%
COLLEGE, 1 YEAR OR MORE
93.9/ 100
METRIC RATING
118th/ 347
METRIC RANK
64.8%
COLLEGE, 1 YEAR OR MORE
99.9/ 100
METRIC RATING
41st/ 347
METRIC RANK
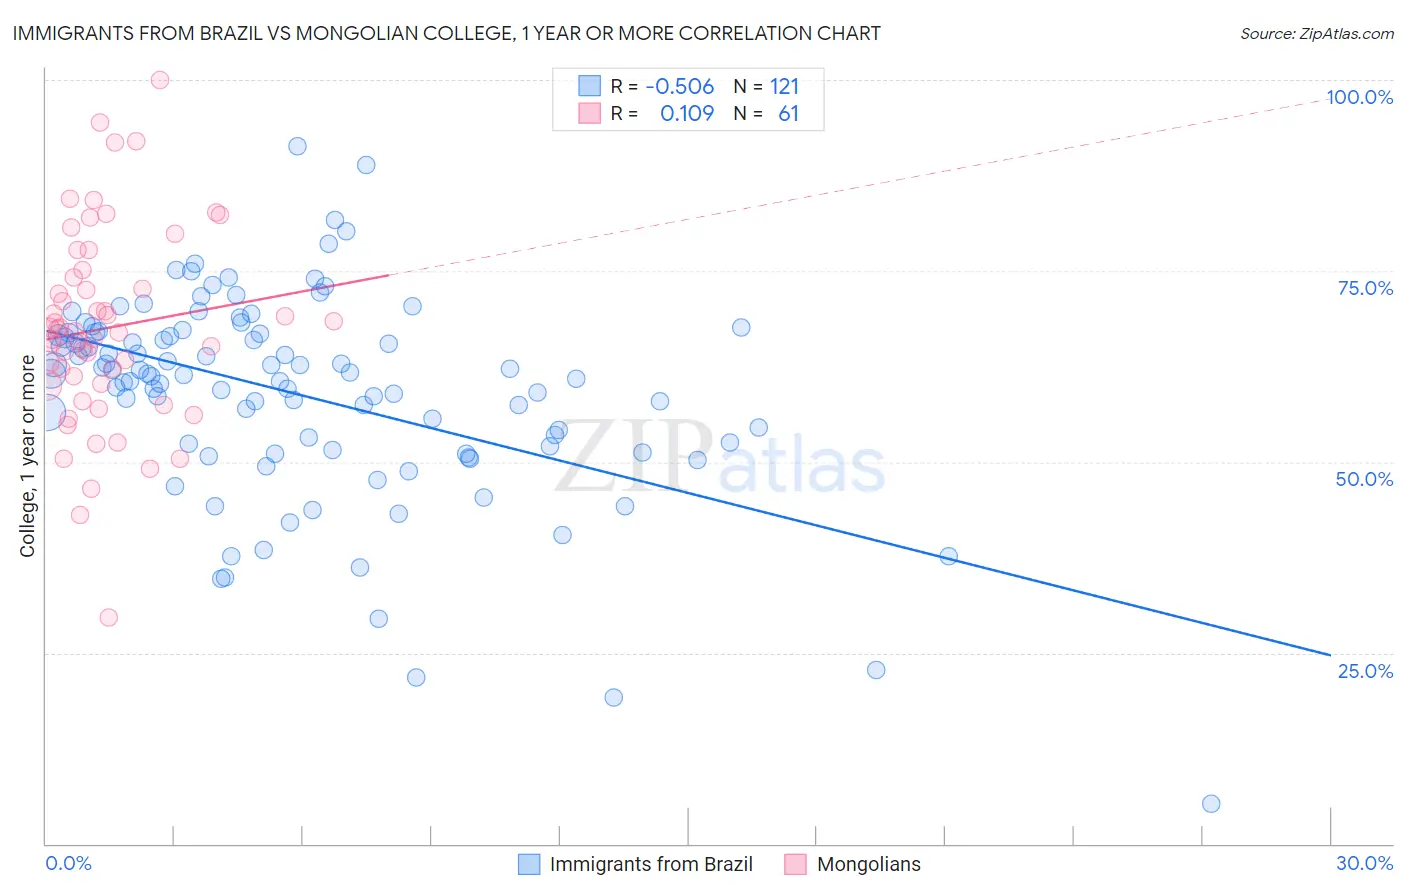
Immigrants from Brazil vs Mongolian College, 1 year or more Correlation Chart
The statistical analysis conducted on geographies consisting of 343,021,697 people shows a substantial negative correlation between the proportion of Immigrants from Brazil and percentage of population with at least college, 1 year or more education in the United States with a correlation coefficient (R) of -0.506 and weighted average of 61.6%. Similarly, the statistical analysis conducted on geographies consisting of 140,362,004 people shows a poor positive correlation between the proportion of Mongolians and percentage of population with at least college, 1 year or more education in the United States with a correlation coefficient (R) of 0.109 and weighted average of 64.8%, a difference of 5.3%.
College, 1 year or more Correlation Summary
| Measurement | Immigrants from Brazil | Mongolian |
| Minimum | 5.3% | 29.5% |
| Maximum | 91.3% | 100.0% |
| Range | 86.0% | 70.5% |
| Mean | 58.8% | 67.5% |
| Median | 61.4% | 67.1% |
| Interquartile 25% (IQ1) | 51.8% | 60.1% |
| Interquartile 75% (IQ3) | 66.8% | 74.6% |
| Interquartile Range (IQR) | 15.0% | 14.5% |
| Standard Deviation (Sample) | 13.5% | 12.9% |
| Standard Deviation (Population) | 13.4% | 12.8% |
Similar Demographics by College, 1 year or more
Demographics Similar to Immigrants from Brazil by College, 1 year or more
In terms of college, 1 year or more, the demographic groups most similar to Immigrants from Brazil are Arab (61.6%, a difference of 0.0%), Lebanese (61.6%, a difference of 0.050%), Assyrian/Chaldean/Syriac (61.5%, a difference of 0.13%), Pakistani (61.5%, a difference of 0.14%), and Norwegian (61.7%, a difference of 0.15%).
| Demographics | Rating | Rank | College, 1 year or more |
| Macedonians | 95.6 /100 | #111 | Exceptional 61.8% |
| Austrians | 95.4 /100 | #112 | Exceptional 61.8% |
| Ukrainians | 95.2 /100 | #113 | Exceptional 61.8% |
| Danes | 94.8 /100 | #114 | Exceptional 61.7% |
| Norwegians | 94.5 /100 | #115 | Exceptional 61.7% |
| Lebanese | 94.1 /100 | #116 | Exceptional 61.6% |
| Arabs | 93.9 /100 | #117 | Exceptional 61.6% |
| Immigrants | Brazil | 93.9 /100 | #118 | Exceptional 61.6% |
| Assyrians/Chaldeans/Syriacs | 93.3 /100 | #119 | Exceptional 61.5% |
| Pakistanis | 93.2 /100 | #120 | Exceptional 61.5% |
| Immigrants | Jordan | 92.7 /100 | #121 | Exceptional 61.4% |
| Immigrants | Chile | 92.3 /100 | #122 | Exceptional 61.4% |
| Serbians | 92.2 /100 | #123 | Exceptional 61.4% |
| Venezuelans | 92.1 /100 | #124 | Exceptional 61.3% |
| Immigrants | Syria | 91.6 /100 | #125 | Exceptional 61.3% |
Demographics Similar to Mongolians by College, 1 year or more
In terms of college, 1 year or more, the demographic groups most similar to Mongolians are Immigrants from Latvia (64.8%, a difference of 0.010%), Immigrants from Russia (64.7%, a difference of 0.13%), Immigrants from Norway (64.7%, a difference of 0.15%), Immigrants from Kuwait (65.0%, a difference of 0.20%), and Estonian (65.0%, a difference of 0.26%).
| Demographics | Rating | Rank | College, 1 year or more |
| Israelis | 99.9 /100 | #34 | Exceptional 65.3% |
| Immigrants | Turkey | 99.9 /100 | #35 | Exceptional 65.2% |
| Immigrants | South Africa | 99.9 /100 | #36 | Exceptional 65.1% |
| Russians | 99.9 /100 | #37 | Exceptional 65.1% |
| Immigrants | Saudi Arabia | 99.9 /100 | #38 | Exceptional 65.0% |
| Estonians | 99.9 /100 | #39 | Exceptional 65.0% |
| Immigrants | Kuwait | 99.9 /100 | #40 | Exceptional 65.0% |
| Mongolians | 99.9 /100 | #41 | Exceptional 64.8% |
| Immigrants | Latvia | 99.9 /100 | #42 | Exceptional 64.8% |
| Immigrants | Russia | 99.9 /100 | #43 | Exceptional 64.7% |
| Immigrants | Norway | 99.9 /100 | #44 | Exceptional 64.7% |
| Immigrants | Lithuania | 99.9 /100 | #45 | Exceptional 64.6% |
| Bhutanese | 99.9 /100 | #46 | Exceptional 64.6% |
| Australians | 99.9 /100 | #47 | Exceptional 64.6% |
| Immigrants | Bulgaria | 99.9 /100 | #48 | Exceptional 64.6% |