Immigrants from Dominica vs Mongolian College, 1 year or more
COMPARE
Immigrants from Dominica
Mongolian
College, 1 year or more
College, 1 year or more Comparison
Immigrants from Dominica
Mongolians
52.5%
COLLEGE, 1 YEAR OR MORE
0.0/ 100
METRIC RATING
298th/ 347
METRIC RANK
64.8%
COLLEGE, 1 YEAR OR MORE
99.9/ 100
METRIC RATING
41st/ 347
METRIC RANK
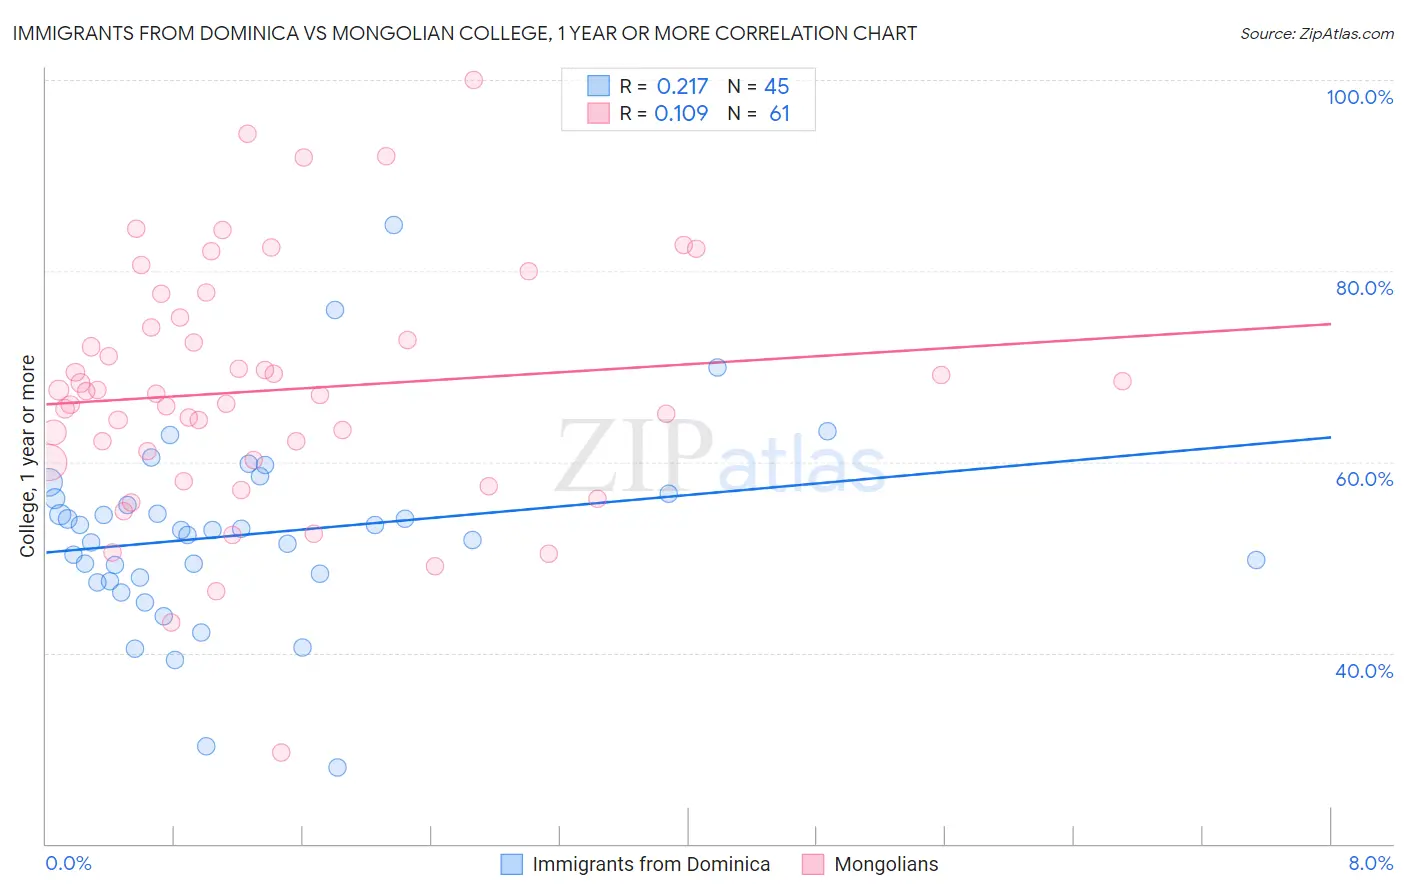
Immigrants from Dominica vs Mongolian College, 1 year or more Correlation Chart
The statistical analysis conducted on geographies consisting of 83,795,636 people shows a weak positive correlation between the proportion of Immigrants from Dominica and percentage of population with at least college, 1 year or more education in the United States with a correlation coefficient (R) of 0.217 and weighted average of 52.5%. Similarly, the statistical analysis conducted on geographies consisting of 140,362,004 people shows a poor positive correlation between the proportion of Mongolians and percentage of population with at least college, 1 year or more education in the United States with a correlation coefficient (R) of 0.109 and weighted average of 64.8%, a difference of 23.4%.
College, 1 year or more Correlation Summary
| Measurement | Immigrants from Dominica | Mongolian |
| Minimum | 28.1% | 29.5% |
| Maximum | 84.8% | 100.0% |
| Range | 56.7% | 70.5% |
| Mean | 52.4% | 67.5% |
| Median | 52.8% | 67.1% |
| Interquartile 25% (IQ1) | 47.7% | 60.1% |
| Interquartile 75% (IQ3) | 56.4% | 74.6% |
| Interquartile Range (IQR) | 8.7% | 14.5% |
| Standard Deviation (Sample) | 10.0% | 12.9% |
| Standard Deviation (Population) | 9.9% | 12.8% |
Similar Demographics by College, 1 year or more
Demographics Similar to Immigrants from Dominica by College, 1 year or more
In terms of college, 1 year or more, the demographic groups most similar to Immigrants from Dominica are Immigrants from Nicaragua (52.4%, a difference of 0.34%), Choctaw (52.3%, a difference of 0.38%), Haitian (52.3%, a difference of 0.44%), Puerto Rican (52.2%, a difference of 0.57%), and Paiute (52.9%, a difference of 0.59%).
| Demographics | Rating | Rank | College, 1 year or more |
| Cubans | 0.0 /100 | #291 | Tragic 53.4% |
| Chickasaw | 0.0 /100 | #292 | Tragic 53.3% |
| Blacks/African Americans | 0.0 /100 | #293 | Tragic 53.3% |
| Cherokee | 0.0 /100 | #294 | Tragic 53.2% |
| Yaqui | 0.0 /100 | #295 | Tragic 53.2% |
| Sioux | 0.0 /100 | #296 | Tragic 53.0% |
| Paiute | 0.0 /100 | #297 | Tragic 52.9% |
| Immigrants | Dominica | 0.0 /100 | #298 | Tragic 52.5% |
| Immigrants | Nicaragua | 0.0 /100 | #299 | Tragic 52.4% |
| Choctaw | 0.0 /100 | #300 | Tragic 52.3% |
| Haitians | 0.0 /100 | #301 | Tragic 52.3% |
| Puerto Ricans | 0.0 /100 | #302 | Tragic 52.2% |
| Creek | 0.0 /100 | #303 | Tragic 52.2% |
| Central Americans | 0.0 /100 | #304 | Tragic 52.1% |
| Seminole | 0.0 /100 | #305 | Tragic 52.1% |
Demographics Similar to Mongolians by College, 1 year or more
In terms of college, 1 year or more, the demographic groups most similar to Mongolians are Immigrants from Latvia (64.8%, a difference of 0.010%), Immigrants from Russia (64.7%, a difference of 0.13%), Immigrants from Norway (64.7%, a difference of 0.15%), Immigrants from Kuwait (65.0%, a difference of 0.20%), and Estonian (65.0%, a difference of 0.26%).
| Demographics | Rating | Rank | College, 1 year or more |
| Israelis | 99.9 /100 | #34 | Exceptional 65.3% |
| Immigrants | Turkey | 99.9 /100 | #35 | Exceptional 65.2% |
| Immigrants | South Africa | 99.9 /100 | #36 | Exceptional 65.1% |
| Russians | 99.9 /100 | #37 | Exceptional 65.1% |
| Immigrants | Saudi Arabia | 99.9 /100 | #38 | Exceptional 65.0% |
| Estonians | 99.9 /100 | #39 | Exceptional 65.0% |
| Immigrants | Kuwait | 99.9 /100 | #40 | Exceptional 65.0% |
| Mongolians | 99.9 /100 | #41 | Exceptional 64.8% |
| Immigrants | Latvia | 99.9 /100 | #42 | Exceptional 64.8% |
| Immigrants | Russia | 99.9 /100 | #43 | Exceptional 64.7% |
| Immigrants | Norway | 99.9 /100 | #44 | Exceptional 64.7% |
| Immigrants | Lithuania | 99.9 /100 | #45 | Exceptional 64.6% |
| Bhutanese | 99.9 /100 | #46 | Exceptional 64.6% |
| Australians | 99.9 /100 | #47 | Exceptional 64.6% |
| Immigrants | Bulgaria | 99.9 /100 | #48 | Exceptional 64.6% |