Croatian vs Celtic 7th Grade
COMPARE
Croatian
Celtic
7th Grade
7th Grade Comparison
Croatians
Celtics
97.4%
7TH GRADE
100.0/ 100
METRIC RATING
23rd/ 347
METRIC RANK
97.1%
7TH GRADE
99.9/ 100
METRIC RATING
48th/ 347
METRIC RANK
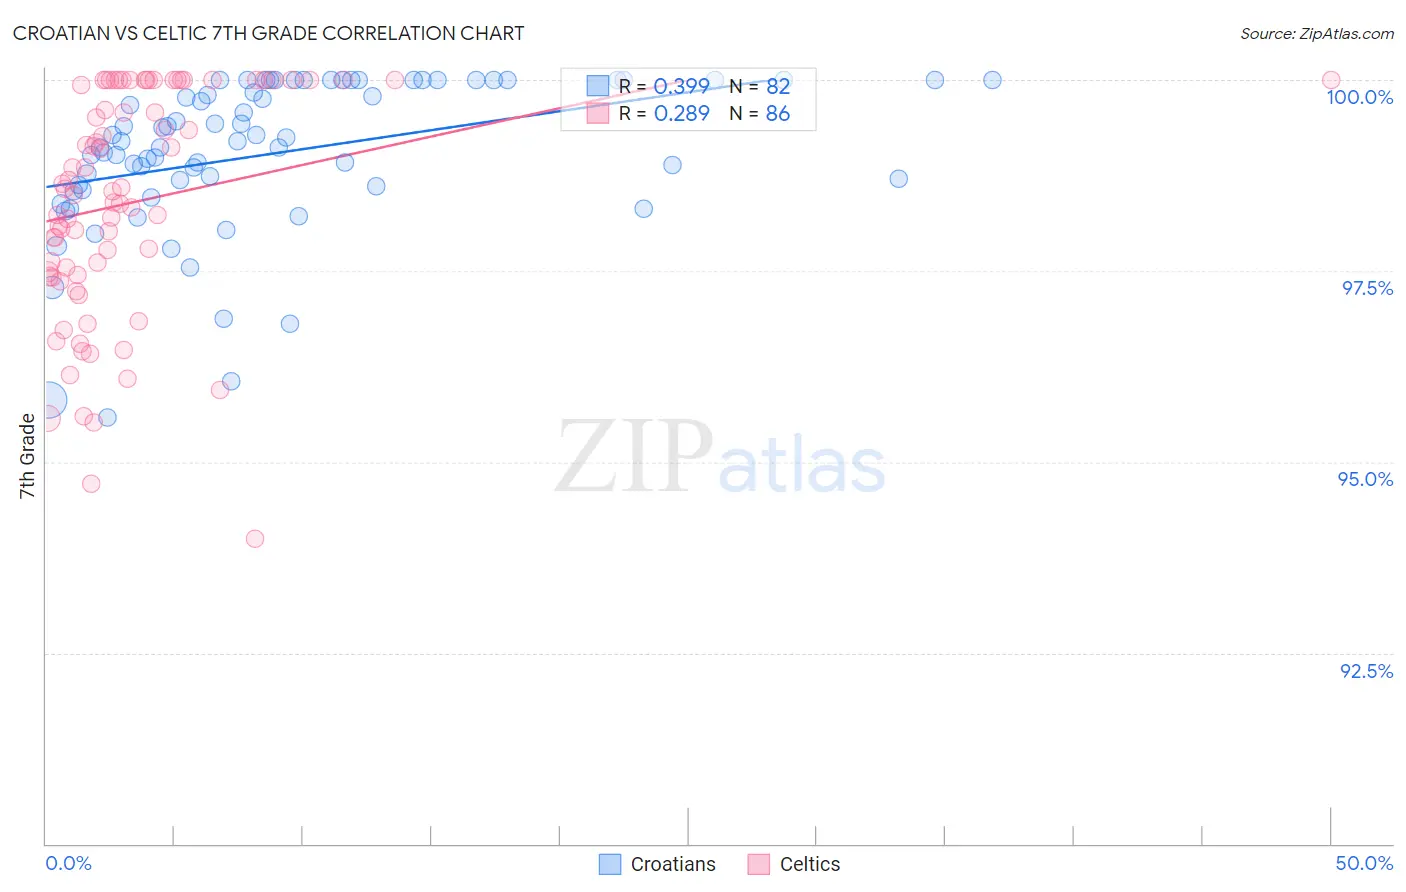
Croatian vs Celtic 7th Grade Correlation Chart
The statistical analysis conducted on geographies consisting of 375,734,226 people shows a mild positive correlation between the proportion of Croatians and percentage of population with at least 7th grade education in the United States with a correlation coefficient (R) of 0.399 and weighted average of 97.4%. Similarly, the statistical analysis conducted on geographies consisting of 168,875,339 people shows a weak positive correlation between the proportion of Celtics and percentage of population with at least 7th grade education in the United States with a correlation coefficient (R) of 0.289 and weighted average of 97.1%, a difference of 0.36%.
7th Grade Correlation Summary
| Measurement | Croatian | Celtic |
| Minimum | 95.6% | 94.0% |
| Maximum | 100.0% | 100.0% |
| Range | 4.4% | 6.0% |
| Mean | 99.0% | 98.4% |
| Median | 99.2% | 98.6% |
| Interquartile 25% (IQ1) | 98.6% | 97.4% |
| Interquartile 75% (IQ3) | 100.0% | 100.0% |
| Interquartile Range (IQR) | 1.4% | 2.6% |
| Standard Deviation (Sample) | 1.0% | 1.5% |
| Standard Deviation (Population) | 1.0% | 1.5% |
Similar Demographics by 7th Grade
Demographics Similar to Croatians by 7th Grade
In terms of 7th grade, the demographic groups most similar to Croatians are Welsh (97.4%, a difference of 0.010%), Inupiat (97.4%, a difference of 0.020%), French Canadian (97.4%, a difference of 0.020%), French (97.4%, a difference of 0.020%), and Scotch-Irish (97.4%, a difference of 0.020%).
| Demographics | Rating | Rank | 7th Grade |
| Irish | 100.0 /100 | #16 | Exceptional 97.5% |
| Scottish | 100.0 /100 | #17 | Exceptional 97.5% |
| Tlingit-Haida | 100.0 /100 | #18 | Exceptional 97.5% |
| Lithuanians | 100.0 /100 | #19 | Exceptional 97.5% |
| Yup'ik | 100.0 /100 | #20 | Exceptional 97.4% |
| Inupiat | 100.0 /100 | #21 | Exceptional 97.4% |
| French Canadians | 100.0 /100 | #22 | Exceptional 97.4% |
| Croatians | 100.0 /100 | #23 | Exceptional 97.4% |
| Welsh | 100.0 /100 | #24 | Exceptional 97.4% |
| French | 100.0 /100 | #25 | Exceptional 97.4% |
| Scotch-Irish | 100.0 /100 | #26 | Exceptional 97.4% |
| Danes | 100.0 /100 | #27 | Exceptional 97.4% |
| Sioux | 100.0 /100 | #28 | Exceptional 97.4% |
| Scandinavians | 100.0 /100 | #29 | Exceptional 97.4% |
| Czechs | 100.0 /100 | #30 | Exceptional 97.4% |
Demographics Similar to Celtics by 7th Grade
In terms of 7th grade, the demographic groups most similar to Celtics are Bulgarian (97.1%, a difference of 0.010%), Slavic (97.1%, a difference of 0.010%), Immigrants from Scotland (97.1%, a difference of 0.010%), Czechoslovakian (97.1%, a difference of 0.030%), and Aleut (97.1%, a difference of 0.030%).
| Demographics | Rating | Rank | 7th Grade |
| Eastern Europeans | 100.0 /100 | #41 | Exceptional 97.2% |
| Chinese | 99.9 /100 | #42 | Exceptional 97.1% |
| Maltese | 99.9 /100 | #43 | Exceptional 97.1% |
| Northern Europeans | 99.9 /100 | #44 | Exceptional 97.1% |
| Czechoslovakians | 99.9 /100 | #45 | Exceptional 97.1% |
| Aleuts | 99.9 /100 | #46 | Exceptional 97.1% |
| Bulgarians | 99.9 /100 | #47 | Exceptional 97.1% |
| Celtics | 99.9 /100 | #48 | Exceptional 97.1% |
| Slavs | 99.9 /100 | #49 | Exceptional 97.1% |
| Immigrants | Scotland | 99.9 /100 | #50 | Exceptional 97.1% |
| Estonians | 99.9 /100 | #51 | Exceptional 97.0% |
| Greeks | 99.9 /100 | #52 | Exceptional 97.0% |
| Austrians | 99.8 /100 | #53 | Exceptional 97.0% |
| Australians | 99.8 /100 | #54 | Exceptional 97.0% |
| Russians | 99.8 /100 | #55 | Exceptional 97.0% |