Immigrants from Latvia vs Immigrants from Kuwait College, 1 year or more
COMPARE
Immigrants from Latvia
Immigrants from Kuwait
College, 1 year or more
College, 1 year or more Comparison
Immigrants from Latvia
Immigrants from Kuwait
64.8%
COLLEGE, 1 YEAR OR MORE
99.9/ 100
METRIC RATING
42nd/ 347
METRIC RANK
65.0%
COLLEGE, 1 YEAR OR MORE
99.9/ 100
METRIC RATING
40th/ 347
METRIC RANK
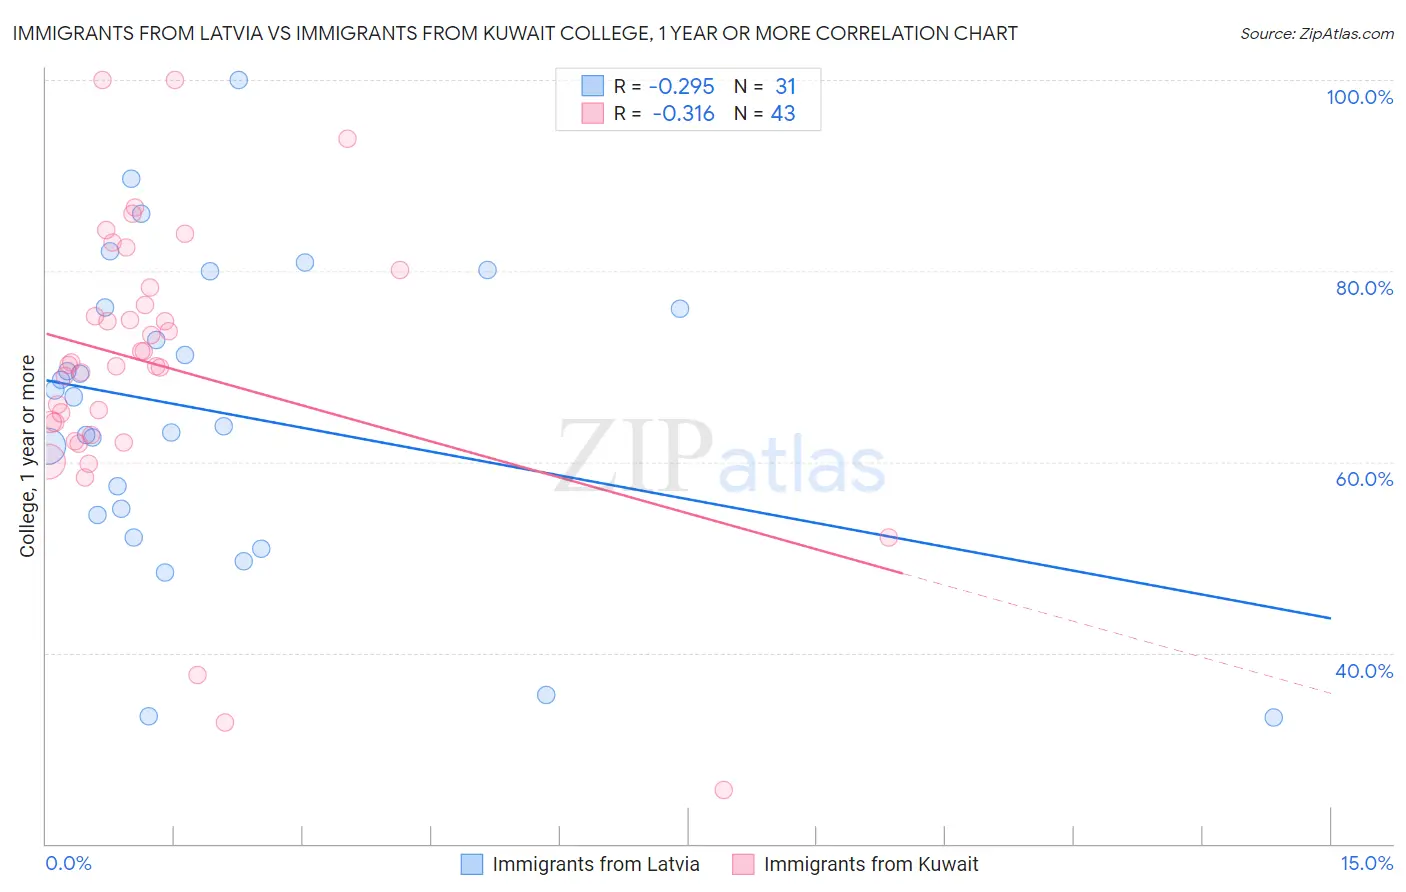
Immigrants from Latvia vs Immigrants from Kuwait College, 1 year or more Correlation Chart
The statistical analysis conducted on geographies consisting of 113,735,345 people shows a weak negative correlation between the proportion of Immigrants from Latvia and percentage of population with at least college, 1 year or more education in the United States with a correlation coefficient (R) of -0.295 and weighted average of 64.8%. Similarly, the statistical analysis conducted on geographies consisting of 136,917,085 people shows a mild negative correlation between the proportion of Immigrants from Kuwait and percentage of population with at least college, 1 year or more education in the United States with a correlation coefficient (R) of -0.316 and weighted average of 65.0%, a difference of 0.21%.
College, 1 year or more Correlation Summary
| Measurement | Immigrants from Latvia | Immigrants from Kuwait |
| Minimum | 33.2% | 25.7% |
| Maximum | 100.0% | 100.0% |
| Range | 66.8% | 74.3% |
| Mean | 65.2% | 70.1% |
| Median | 66.8% | 70.2% |
| Interquartile 25% (IQ1) | 54.4% | 62.8% |
| Interquartile 75% (IQ3) | 76.2% | 78.3% |
| Interquartile Range (IQR) | 21.8% | 15.4% |
| Standard Deviation (Sample) | 16.0% | 14.9% |
| Standard Deviation (Population) | 15.8% | 14.8% |
Demographics Similar to Immigrants from Latvia and Immigrants from Kuwait by College, 1 year or more
In terms of college, 1 year or more, the demographic groups most similar to Immigrants from Latvia are Mongolian (64.8%, a difference of 0.010%), Immigrants from Russia (64.7%, a difference of 0.12%), Immigrants from Norway (64.7%, a difference of 0.14%), Estonian (65.0%, a difference of 0.27%), and Immigrants from Lithuania (64.6%, a difference of 0.31%). Similarly, the demographic groups most similar to Immigrants from Kuwait are Estonian (65.0%, a difference of 0.060%), Immigrants from Saudi Arabia (65.0%, a difference of 0.13%), Mongolian (64.8%, a difference of 0.20%), Russian (65.1%, a difference of 0.28%), and Immigrants from South Africa (65.1%, a difference of 0.29%).
| Demographics | Rating | Rank | College, 1 year or more |
| Turks | 100.0 /100 | #31 | Exceptional 65.5% |
| Bulgarians | 100.0 /100 | #32 | Exceptional 65.5% |
| Immigrants | Sri Lanka | 99.9 /100 | #33 | Exceptional 65.4% |
| Israelis | 99.9 /100 | #34 | Exceptional 65.3% |
| Immigrants | Turkey | 99.9 /100 | #35 | Exceptional 65.2% |
| Immigrants | South Africa | 99.9 /100 | #36 | Exceptional 65.1% |
| Russians | 99.9 /100 | #37 | Exceptional 65.1% |
| Immigrants | Saudi Arabia | 99.9 /100 | #38 | Exceptional 65.0% |
| Estonians | 99.9 /100 | #39 | Exceptional 65.0% |
| Immigrants | Kuwait | 99.9 /100 | #40 | Exceptional 65.0% |
| Mongolians | 99.9 /100 | #41 | Exceptional 64.8% |
| Immigrants | Latvia | 99.9 /100 | #42 | Exceptional 64.8% |
| Immigrants | Russia | 99.9 /100 | #43 | Exceptional 64.7% |
| Immigrants | Norway | 99.9 /100 | #44 | Exceptional 64.7% |
| Immigrants | Lithuania | 99.9 /100 | #45 | Exceptional 64.6% |
| Bhutanese | 99.9 /100 | #46 | Exceptional 64.6% |
| Australians | 99.9 /100 | #47 | Exceptional 64.6% |
| Immigrants | Bulgaria | 99.9 /100 | #48 | Exceptional 64.6% |
| New Zealanders | 99.9 /100 | #49 | Exceptional 64.6% |
| Immigrants | Austria | 99.8 /100 | #50 | Exceptional 64.4% |
| Immigrants | Malaysia | 99.8 /100 | #51 | Exceptional 64.3% |