Creek vs Immigrants from Kenya Doctorate Degree
COMPARE
Creek
Immigrants from Kenya
Doctorate Degree
Doctorate Degree Comparison
Creek
Immigrants from Kenya
1.3%
DOCTORATE DEGREE
0.1/ 100
METRIC RATING
318th/ 347
METRIC RANK
1.9%
DOCTORATE DEGREE
74.3/ 100
METRIC RATING
152nd/ 347
METRIC RANK
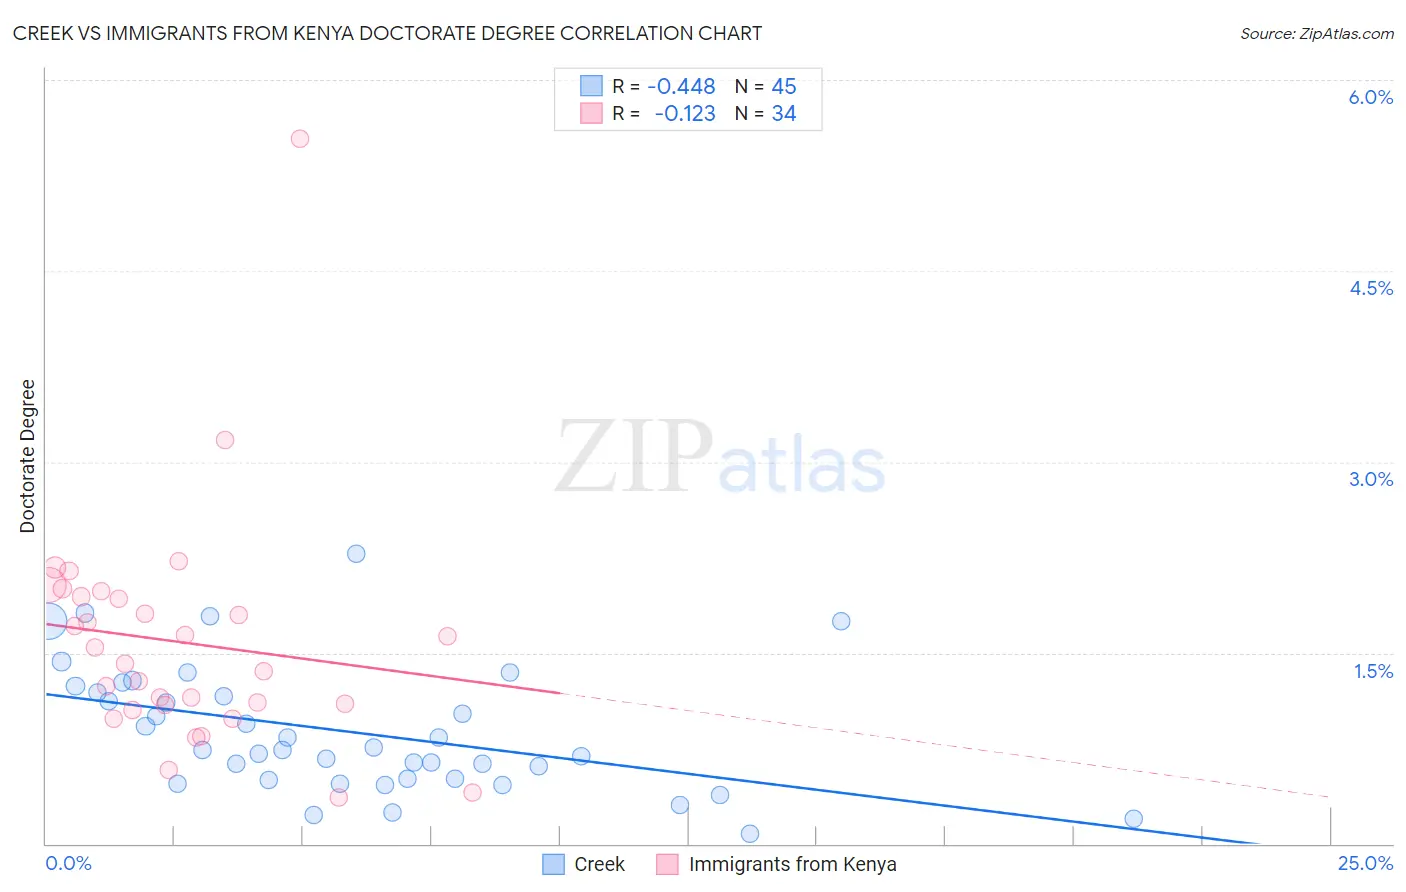
Creek vs Immigrants from Kenya Doctorate Degree Correlation Chart
The statistical analysis conducted on geographies consisting of 176,594,001 people shows a moderate negative correlation between the proportion of Creek and percentage of population with at least doctorate degree education in the United States with a correlation coefficient (R) of -0.448 and weighted average of 1.3%. Similarly, the statistical analysis conducted on geographies consisting of 217,428,476 people shows a poor negative correlation between the proportion of Immigrants from Kenya and percentage of population with at least doctorate degree education in the United States with a correlation coefficient (R) of -0.123 and weighted average of 1.9%, a difference of 41.9%.
Doctorate Degree Correlation Summary
| Measurement | Creek | Immigrants from Kenya |
| Minimum | 0.080% | 0.36% |
| Maximum | 2.3% | 5.5% |
| Range | 2.2% | 5.2% |
| Mean | 0.88% | 1.6% |
| Median | 0.74% | 1.5% |
| Interquartile 25% (IQ1) | 0.50% | 1.1% |
| Interquartile 75% (IQ3) | 1.2% | 1.9% |
| Interquartile Range (IQR) | 0.71% | 0.85% |
| Standard Deviation (Sample) | 0.50% | 0.91% |
| Standard Deviation (Population) | 0.49% | 0.90% |
Similar Demographics by Doctorate Degree
Demographics Similar to Creek by Doctorate Degree
In terms of doctorate degree, the demographic groups most similar to Creek are Immigrants from Micronesia (1.3%, a difference of 0.050%), Navajo (1.4%, a difference of 0.30%), Immigrants from the Azores (1.4%, a difference of 0.51%), Dominican (1.4%, a difference of 0.53%), and Menominee (1.4%, a difference of 0.61%).
| Demographics | Rating | Rank | Doctorate Degree |
| Immigrants | Honduras | 0.1 /100 | #311 | Tragic 1.4% |
| Immigrants | Nicaragua | 0.1 /100 | #312 | Tragic 1.4% |
| Menominee | 0.1 /100 | #313 | Tragic 1.4% |
| Dominicans | 0.1 /100 | #314 | Tragic 1.4% |
| Immigrants | Azores | 0.1 /100 | #315 | Tragic 1.4% |
| Navajo | 0.1 /100 | #316 | Tragic 1.4% |
| Immigrants | Micronesia | 0.1 /100 | #317 | Tragic 1.3% |
| Creek | 0.1 /100 | #318 | Tragic 1.3% |
| Immigrants | Guyana | 0.1 /100 | #319 | Tragic 1.3% |
| Immigrants | St. Vincent and the Grenadines | 0.1 /100 | #320 | Tragic 1.3% |
| Dutch West Indians | 0.1 /100 | #321 | Tragic 1.3% |
| Seminole | 0.1 /100 | #322 | Tragic 1.3% |
| Immigrants | Belize | 0.1 /100 | #323 | Tragic 1.3% |
| Natives/Alaskans | 0.0 /100 | #324 | Tragic 1.3% |
| Pima | 0.0 /100 | #325 | Tragic 1.3% |
Demographics Similar to Immigrants from Kenya by Doctorate Degree
In terms of doctorate degree, the demographic groups most similar to Immigrants from Kenya are Immigrants from Oceania (1.9%, a difference of 0.050%), Albanian (1.9%, a difference of 0.10%), Immigrants from Albania (1.9%, a difference of 0.27%), Polish (1.9%, a difference of 0.29%), and English (1.9%, a difference of 0.30%).
| Demographics | Rating | Rank | Doctorate Degree |
| Kenyans | 83.6 /100 | #145 | Excellent 1.9% |
| Immigrants | Syria | 83.6 /100 | #146 | Excellent 1.9% |
| Immigrants | Senegal | 82.5 /100 | #147 | Excellent 1.9% |
| Luxembourgers | 81.1 /100 | #148 | Excellent 1.9% |
| Basques | 76.9 /100 | #149 | Good 1.9% |
| English | 75.9 /100 | #150 | Good 1.9% |
| Albanians | 74.8 /100 | #151 | Good 1.9% |
| Immigrants | Kenya | 74.3 /100 | #152 | Good 1.9% |
| Immigrants | Oceania | 74.0 /100 | #153 | Good 1.9% |
| Immigrants | Albania | 72.8 /100 | #154 | Good 1.9% |
| Poles | 72.7 /100 | #155 | Good 1.9% |
| Slavs | 72.4 /100 | #156 | Good 1.9% |
| Danes | 71.9 /100 | #157 | Good 1.9% |
| Hungarians | 71.7 /100 | #158 | Good 1.9% |
| Slovenes | 70.2 /100 | #159 | Good 1.9% |