Immigrants from Poland vs Pima Professional Degree
COMPARE
Immigrants from Poland
Pima
Professional Degree
Professional Degree Comparison
Immigrants from Poland
Pima
4.3%
PROFESSIONAL DEGREE
29.2/ 100
METRIC RATING
190th/ 347
METRIC RANK
3.3%
PROFESSIONAL DEGREE
0.1/ 100
METRIC RATING
309th/ 347
METRIC RANK
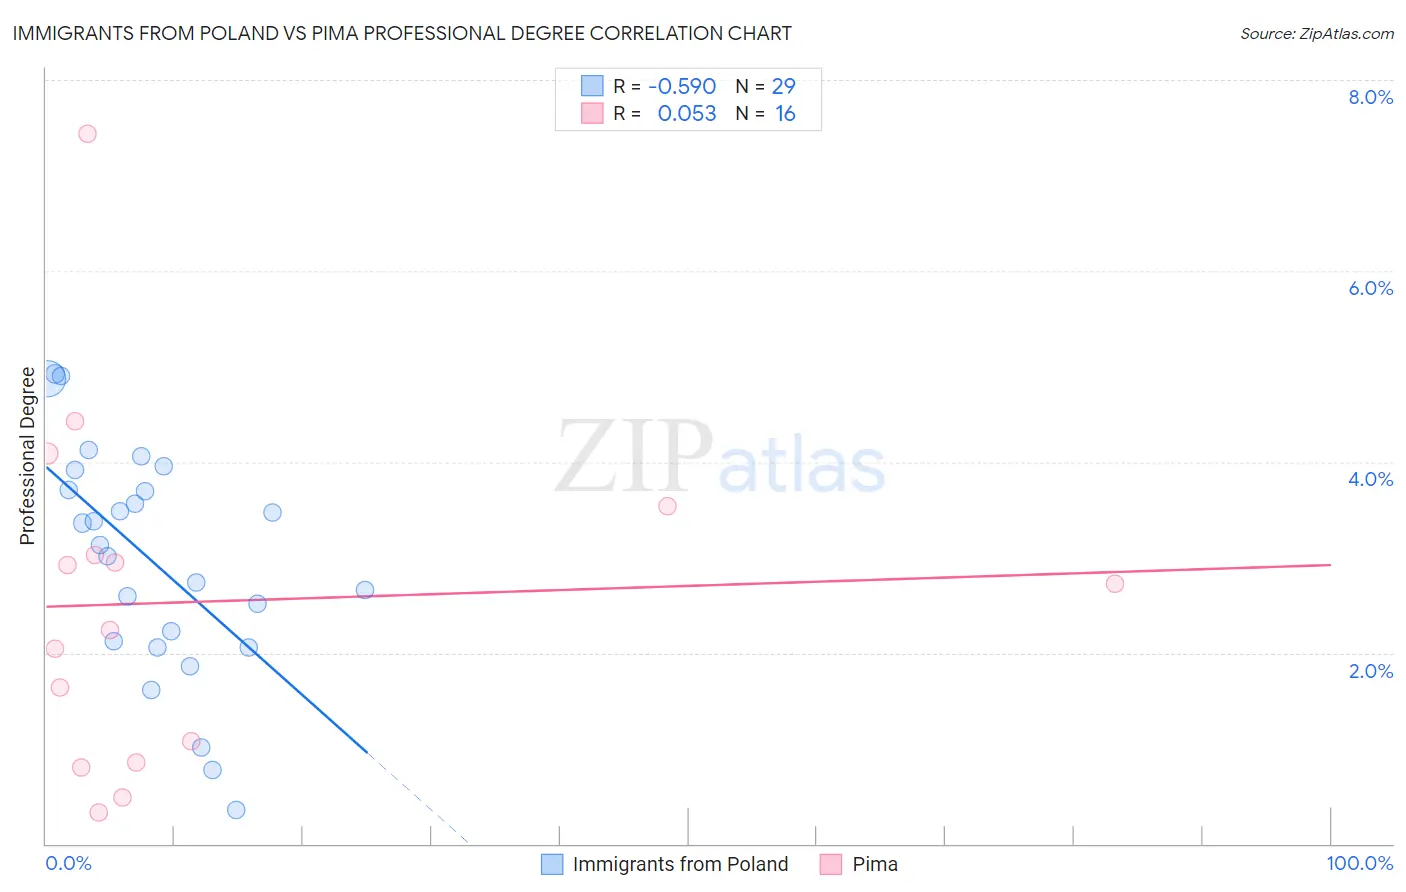
Immigrants from Poland vs Pima Professional Degree Correlation Chart
The statistical analysis conducted on geographies consisting of 304,504,967 people shows a substantial negative correlation between the proportion of Immigrants from Poland and percentage of population with at least professional degree education in the United States with a correlation coefficient (R) of -0.590 and weighted average of 4.3%. Similarly, the statistical analysis conducted on geographies consisting of 61,434,084 people shows a slight positive correlation between the proportion of Pima and percentage of population with at least professional degree education in the United States with a correlation coefficient (R) of 0.053 and weighted average of 3.3%, a difference of 28.9%.
Professional Degree Correlation Summary
| Measurement | Immigrants from Poland | Pima |
| Minimum | 0.35% | 0.33% |
| Maximum | 4.9% | 7.4% |
| Range | 4.6% | 7.1% |
| Mean | 3.0% | 2.5% |
| Median | 3.1% | 2.5% |
| Interquartile 25% (IQ1) | 2.1% | 0.96% |
| Interquartile 75% (IQ3) | 3.8% | 3.3% |
| Interquartile Range (IQR) | 1.7% | 2.3% |
| Standard Deviation (Sample) | 1.2% | 1.8% |
| Standard Deviation (Population) | 1.2% | 1.8% |
Similar Demographics by Professional Degree
Demographics Similar to Immigrants from Poland by Professional Degree
In terms of professional degree, the demographic groups most similar to Immigrants from Poland are Sri Lankan (4.3%, a difference of 0.040%), Slovak (4.3%, a difference of 0.26%), Ghanaian (4.3%, a difference of 0.36%), French (4.2%, a difference of 0.40%), and Immigrants from Thailand (4.3%, a difference of 0.44%).
| Demographics | Rating | Rank | Professional Degree |
| Bermudans | 43.1 /100 | #183 | Average 4.4% |
| Belgians | 36.2 /100 | #184 | Fair 4.3% |
| Welsh | 35.8 /100 | #185 | Fair 4.3% |
| Scotch-Irish | 34.2 /100 | #186 | Fair 4.3% |
| Immigrants | Cameroon | 33.3 /100 | #187 | Fair 4.3% |
| Immigrants | Thailand | 31.7 /100 | #188 | Fair 4.3% |
| Slovaks | 30.7 /100 | #189 | Fair 4.3% |
| Immigrants | Poland | 29.2 /100 | #190 | Fair 4.3% |
| Sri Lankans | 29.0 /100 | #191 | Fair 4.3% |
| Ghanaians | 27.3 /100 | #192 | Fair 4.3% |
| French | 27.1 /100 | #193 | Fair 4.2% |
| Scandinavians | 25.8 /100 | #194 | Fair 4.2% |
| Nigerians | 24.6 /100 | #195 | Fair 4.2% |
| Spanish | 23.0 /100 | #196 | Fair 4.2% |
| Czechoslovakians | 22.4 /100 | #197 | Fair 4.2% |
Demographics Similar to Pima by Professional Degree
In terms of professional degree, the demographic groups most similar to Pima are Shoshone (3.3%, a difference of 0.010%), Immigrants from Latin America (3.3%, a difference of 0.32%), Cherokee (3.3%, a difference of 0.47%), Samoan (3.3%, a difference of 0.51%), and Sioux (3.3%, a difference of 1.1%).
| Demographics | Rating | Rank | Professional Degree |
| Malaysians | 0.2 /100 | #302 | Tragic 3.4% |
| Immigrants | Haiti | 0.2 /100 | #303 | Tragic 3.4% |
| Cajuns | 0.2 /100 | #304 | Tragic 3.4% |
| Chickasaw | 0.1 /100 | #305 | Tragic 3.4% |
| Cape Verdeans | 0.1 /100 | #306 | Tragic 3.4% |
| Samoans | 0.1 /100 | #307 | Tragic 3.3% |
| Shoshone | 0.1 /100 | #308 | Tragic 3.3% |
| Pima | 0.1 /100 | #309 | Tragic 3.3% |
| Immigrants | Latin America | 0.1 /100 | #310 | Tragic 3.3% |
| Cherokee | 0.1 /100 | #311 | Tragic 3.3% |
| Sioux | 0.1 /100 | #312 | Tragic 3.3% |
| Yuman | 0.1 /100 | #313 | Tragic 3.3% |
| Mexican American Indians | 0.1 /100 | #314 | Tragic 3.3% |
| Immigrants | Laos | 0.1 /100 | #315 | Tragic 3.2% |
| Puerto Ricans | 0.1 /100 | #316 | Tragic 3.2% |