Immigrants from Northern Europe vs Immigrants from Kazakhstan No Schooling Completed
COMPARE
Immigrants from Northern Europe
Immigrants from Kazakhstan
No Schooling Completed
No Schooling Completed Comparison
Immigrants from Northern Europe
Immigrants from Kazakhstan
1.7%
NO SCHOOLING COMPLETED
99.8/ 100
METRIC RATING
62nd/ 347
METRIC RANK
2.1%
NO SCHOOLING COMPLETED
44.3/ 100
METRIC RATING
179th/ 347
METRIC RANK
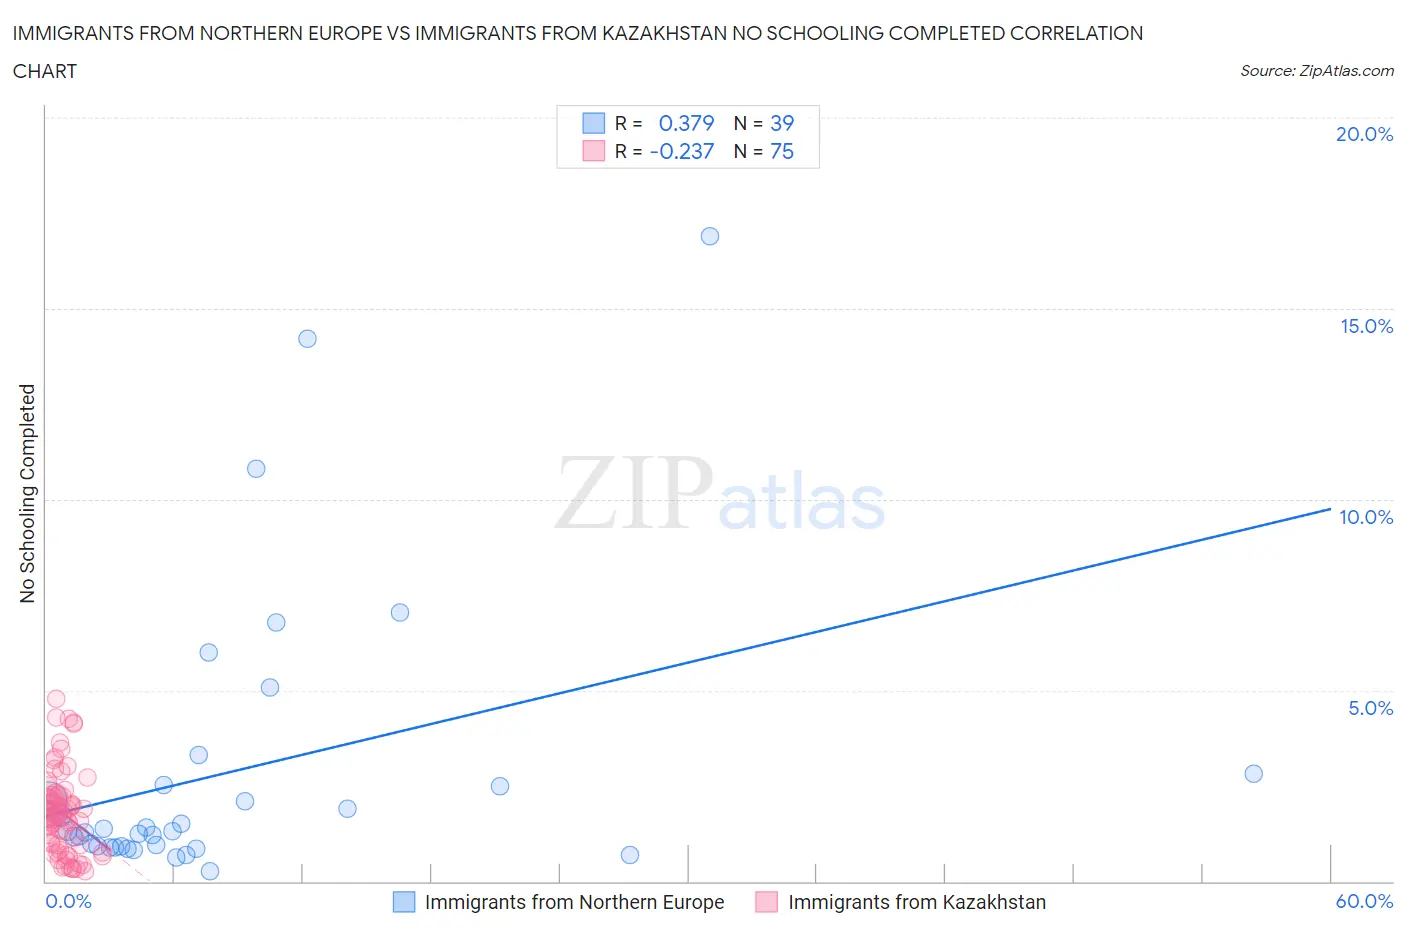
Immigrants from Northern Europe vs Immigrants from Kazakhstan No Schooling Completed Correlation Chart
The statistical analysis conducted on geographies consisting of 468,916,494 people shows a mild positive correlation between the proportion of Immigrants from Northern Europe and percentage of population with no schooling in the United States with a correlation coefficient (R) of 0.379 and weighted average of 1.7%. Similarly, the statistical analysis conducted on geographies consisting of 123,956,423 people shows a weak negative correlation between the proportion of Immigrants from Kazakhstan and percentage of population with no schooling in the United States with a correlation coefficient (R) of -0.237 and weighted average of 2.1%, a difference of 26.4%.
No Schooling Completed Correlation Summary
| Measurement | Immigrants from Northern Europe | Immigrants from Kazakhstan |
| Minimum | 0.25% | 0.26% |
| Maximum | 16.9% | 4.8% |
| Range | 16.7% | 4.5% |
| Mean | 2.8% | 1.8% |
| Median | 1.3% | 1.7% |
| Interquartile 25% (IQ1) | 0.91% | 0.95% |
| Interquartile 75% (IQ3) | 2.5% | 2.2% |
| Interquartile Range (IQR) | 1.6% | 1.3% |
| Standard Deviation (Sample) | 3.7% | 1.1% |
| Standard Deviation (Population) | 3.7% | 1.1% |
Similar Demographics by No Schooling Completed
Demographics Similar to Immigrants from Northern Europe by No Schooling Completed
In terms of no schooling completed, the demographic groups most similar to Immigrants from Northern Europe are Russian (1.7%, a difference of 0.040%), New Zealander (1.7%, a difference of 0.20%), Serbian (1.7%, a difference of 0.24%), Canadian (1.7%, a difference of 0.38%), and Immigrants from Austria (1.7%, a difference of 0.57%).
| Demographics | Rating | Rank | No Schooling Completed |
| Greeks | 99.8 /100 | #55 | Exceptional 1.6% |
| Immigrants | North America | 99.8 /100 | #56 | Exceptional 1.6% |
| Austrians | 99.8 /100 | #57 | Exceptional 1.6% |
| Kiowa | 99.8 /100 | #58 | Exceptional 1.6% |
| Slavs | 99.8 /100 | #59 | Exceptional 1.7% |
| Americans | 99.8 /100 | #60 | Exceptional 1.7% |
| Tsimshian | 99.8 /100 | #61 | Exceptional 1.7% |
| Immigrants | Northern Europe | 99.8 /100 | #62 | Exceptional 1.7% |
| Russians | 99.8 /100 | #63 | Exceptional 1.7% |
| New Zealanders | 99.7 /100 | #64 | Exceptional 1.7% |
| Serbians | 99.7 /100 | #65 | Exceptional 1.7% |
| Canadians | 99.7 /100 | #66 | Exceptional 1.7% |
| Immigrants | Austria | 99.7 /100 | #67 | Exceptional 1.7% |
| Immigrants | Lithuania | 99.7 /100 | #68 | Exceptional 1.7% |
| Chickasaw | 99.6 /100 | #69 | Exceptional 1.7% |
Demographics Similar to Immigrants from Kazakhstan by No Schooling Completed
In terms of no schooling completed, the demographic groups most similar to Immigrants from Kazakhstan are Pakistani (2.1%, a difference of 0.050%), Portuguese (2.1%, a difference of 0.060%), Arapaho (2.1%, a difference of 0.10%), Panamanian (2.1%, a difference of 0.11%), and Immigrants from Taiwan (2.1%, a difference of 0.24%).
| Demographics | Rating | Rank | No Schooling Completed |
| Immigrants | Argentina | 52.7 /100 | #172 | Average 2.1% |
| Immigrants | Belarus | 51.8 /100 | #173 | Average 2.1% |
| Immigrants | Micronesia | 50.0 /100 | #174 | Average 2.1% |
| Arabs | 46.4 /100 | #175 | Average 2.1% |
| Panamanians | 45.2 /100 | #176 | Average 2.1% |
| Arapaho | 45.0 /100 | #177 | Average 2.1% |
| Pakistanis | 44.7 /100 | #178 | Average 2.1% |
| Immigrants | Kazakhstan | 44.3 /100 | #179 | Average 2.1% |
| Portuguese | 43.9 /100 | #180 | Average 2.1% |
| Immigrants | Taiwan | 42.6 /100 | #181 | Average 2.1% |
| French American Indians | 42.2 /100 | #182 | Average 2.1% |
| Blacks/African Americans | 41.4 /100 | #183 | Average 2.1% |
| Pima | 41.3 /100 | #184 | Average 2.1% |
| Mongolians | 40.8 /100 | #185 | Average 2.1% |
| Immigrants | Bosnia and Herzegovina | 38.6 /100 | #186 | Fair 2.1% |