Creek vs Guamanian/Chamorro Householder Income Ages 45 - 64 years
COMPARE
Creek
Guamanian/Chamorro
Householder Income Ages 45 - 64 years
Householder Income Ages 45 - 64 years Comparison
Creek
Guamanians/Chamorros
$78,960
HOUSEHOLDER INCOME AGES 45 - 64 YEARS
0.0/ 100
METRIC RATING
330th/ 347
METRIC RANK
$101,170
HOUSEHOLDER INCOME AGES 45 - 64 YEARS
60.5/ 100
METRIC RATING
169th/ 347
METRIC RANK
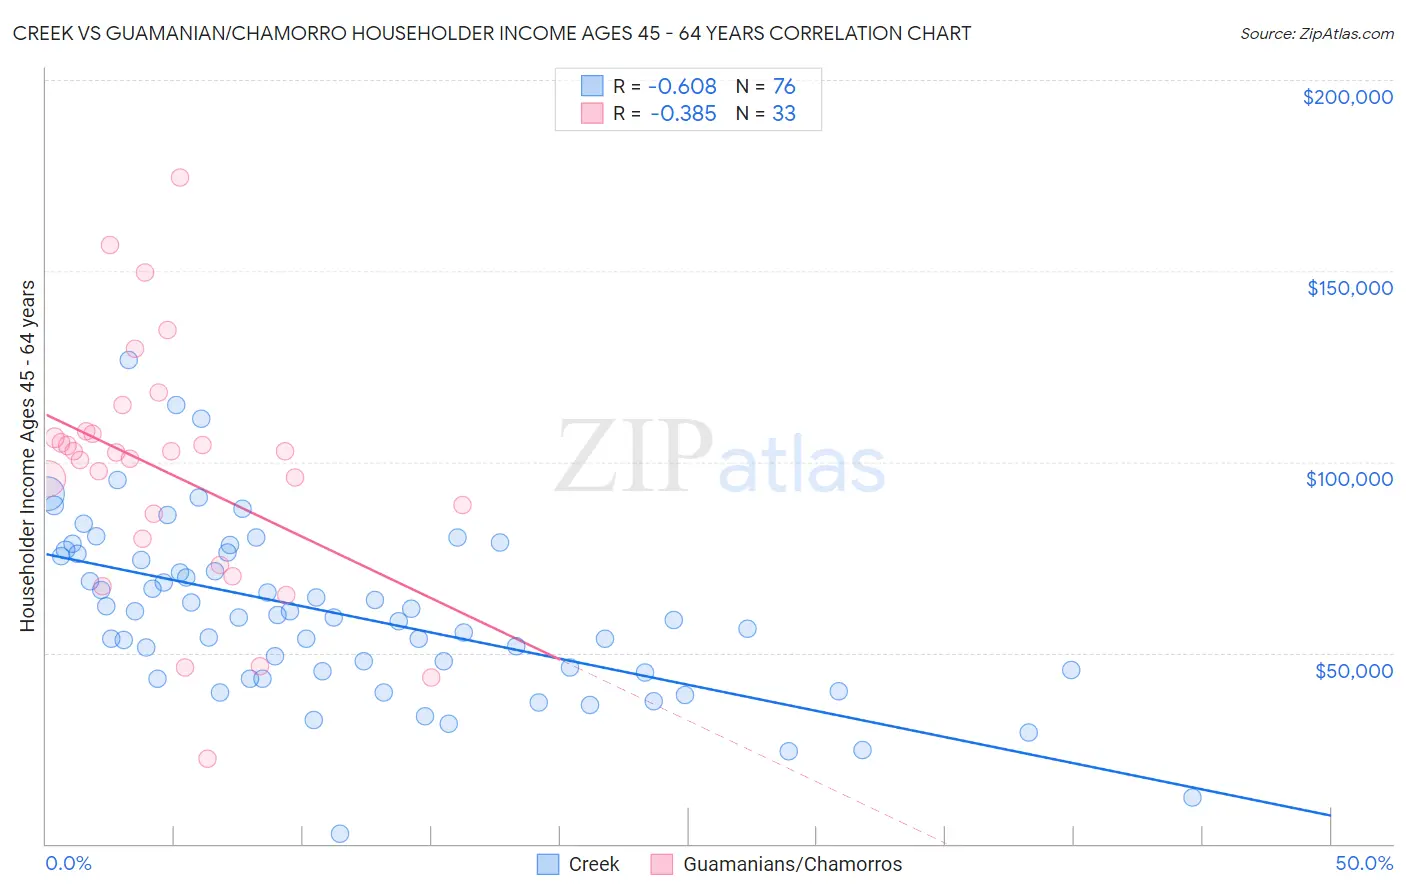
Creek vs Guamanian/Chamorro Householder Income Ages 45 - 64 years Correlation Chart
The statistical analysis conducted on geographies consisting of 178,286,108 people shows a significant negative correlation between the proportion of Creek and household income with householder between the ages 45 and 64 in the United States with a correlation coefficient (R) of -0.608 and weighted average of $78,960. Similarly, the statistical analysis conducted on geographies consisting of 221,751,742 people shows a mild negative correlation between the proportion of Guamanians/Chamorros and household income with householder between the ages 45 and 64 in the United States with a correlation coefficient (R) of -0.385 and weighted average of $101,170, a difference of 28.1%.
Householder Income Ages 45 - 64 years Correlation Summary
| Measurement | Creek | Guamanian/Chamorro |
| Minimum | $2,499 | $22,381 |
| Maximum | $126,578 | $174,529 |
| Range | $124,079 | $152,148 |
| Mean | $60,049 | $97,072 |
| Median | $59,292 | $102,408 |
| Interquartile 25% (IQ1) | $45,146 | $76,408 |
| Interquartile 75% (IQ3) | $75,639 | $107,629 |
| Interquartile Range (IQR) | $30,493 | $31,221 |
| Standard Deviation (Sample) | $22,341 | $32,320 |
| Standard Deviation (Population) | $22,193 | $31,826 |
Similar Demographics by Householder Income Ages 45 - 64 years
Demographics Similar to Creek by Householder Income Ages 45 - 64 years
In terms of householder income ages 45 - 64 years, the demographic groups most similar to Creek are Immigrants from Dominican Republic ($78,836, a difference of 0.16%), Dutch West Indian ($79,171, a difference of 0.27%), Black/African American ($78,556, a difference of 0.51%), Native/Alaskan ($79,816, a difference of 1.1%), and Seminole ($80,077, a difference of 1.4%).
| Demographics | Rating | Rank | Householder Income Ages 45 - 64 years |
| Bahamians | 0.0 /100 | #323 | Tragic $81,369 |
| Yup'ik | 0.0 /100 | #324 | Tragic $81,000 |
| Immigrants | Cuba | 0.0 /100 | #325 | Tragic $80,662 |
| Dominicans | 0.0 /100 | #326 | Tragic $80,623 |
| Seminole | 0.0 /100 | #327 | Tragic $80,077 |
| Natives/Alaskans | 0.0 /100 | #328 | Tragic $79,816 |
| Dutch West Indians | 0.0 /100 | #329 | Tragic $79,171 |
| Creek | 0.0 /100 | #330 | Tragic $78,960 |
| Immigrants | Dominican Republic | 0.0 /100 | #331 | Tragic $78,836 |
| Blacks/African Americans | 0.0 /100 | #332 | Tragic $78,556 |
| Immigrants | Congo | 0.0 /100 | #333 | Tragic $77,850 |
| Menominee | 0.0 /100 | #334 | Tragic $76,903 |
| Cheyenne | 0.0 /100 | #335 | Tragic $76,362 |
| Arapaho | 0.0 /100 | #336 | Tragic $75,945 |
| Pueblo | 0.0 /100 | #337 | Tragic $75,601 |
Demographics Similar to Guamanians/Chamorros by Householder Income Ages 45 - 64 years
In terms of householder income ages 45 - 64 years, the demographic groups most similar to Guamanians/Chamorros are South American Indian ($101,171, a difference of 0.0%), Slovak ($101,029, a difference of 0.14%), Czechoslovakian ($101,387, a difference of 0.21%), South American ($100,837, a difference of 0.33%), and Samoan ($101,580, a difference of 0.41%).
| Demographics | Rating | Rank | Householder Income Ages 45 - 64 years |
| Scottish | 71.1 /100 | #162 | Good $102,123 |
| English | 70.1 /100 | #163 | Good $102,021 |
| Immigrants | Morocco | 70.0 /100 | #164 | Good $102,015 |
| Immigrants | Albania | 69.4 /100 | #165 | Good $101,957 |
| Samoans | 65.3 /100 | #166 | Good $101,580 |
| Czechoslovakians | 63.0 /100 | #167 | Good $101,387 |
| South American Indians | 60.5 /100 | #168 | Good $101,171 |
| Guamanians/Chamorros | 60.5 /100 | #169 | Good $101,170 |
| Slovaks | 58.8 /100 | #170 | Average $101,029 |
| South Americans | 56.4 /100 | #171 | Average $100,837 |
| Immigrants | Uzbekistan | 52.5 /100 | #172 | Average $100,523 |
| Alsatians | 51.4 /100 | #173 | Average $100,435 |
| Welsh | 50.0 /100 | #174 | Average $100,322 |
| Germans | 48.8 /100 | #175 | Average $100,224 |
| Immigrants | Costa Rica | 47.7 /100 | #176 | Average $100,141 |