Immigrants from Lebanon vs Guamanian/Chamorro No Schooling Completed
COMPARE
Immigrants from Lebanon
Guamanian/Chamorro
No Schooling Completed
No Schooling Completed Comparison
Immigrants from Lebanon
Guamanians/Chamorros
2.3%
NO SCHOOLING COMPLETED
4.5/ 100
METRIC RATING
223rd/ 347
METRIC RANK
2.2%
NO SCHOOLING COMPLETED
29.8/ 100
METRIC RATING
192nd/ 347
METRIC RANK
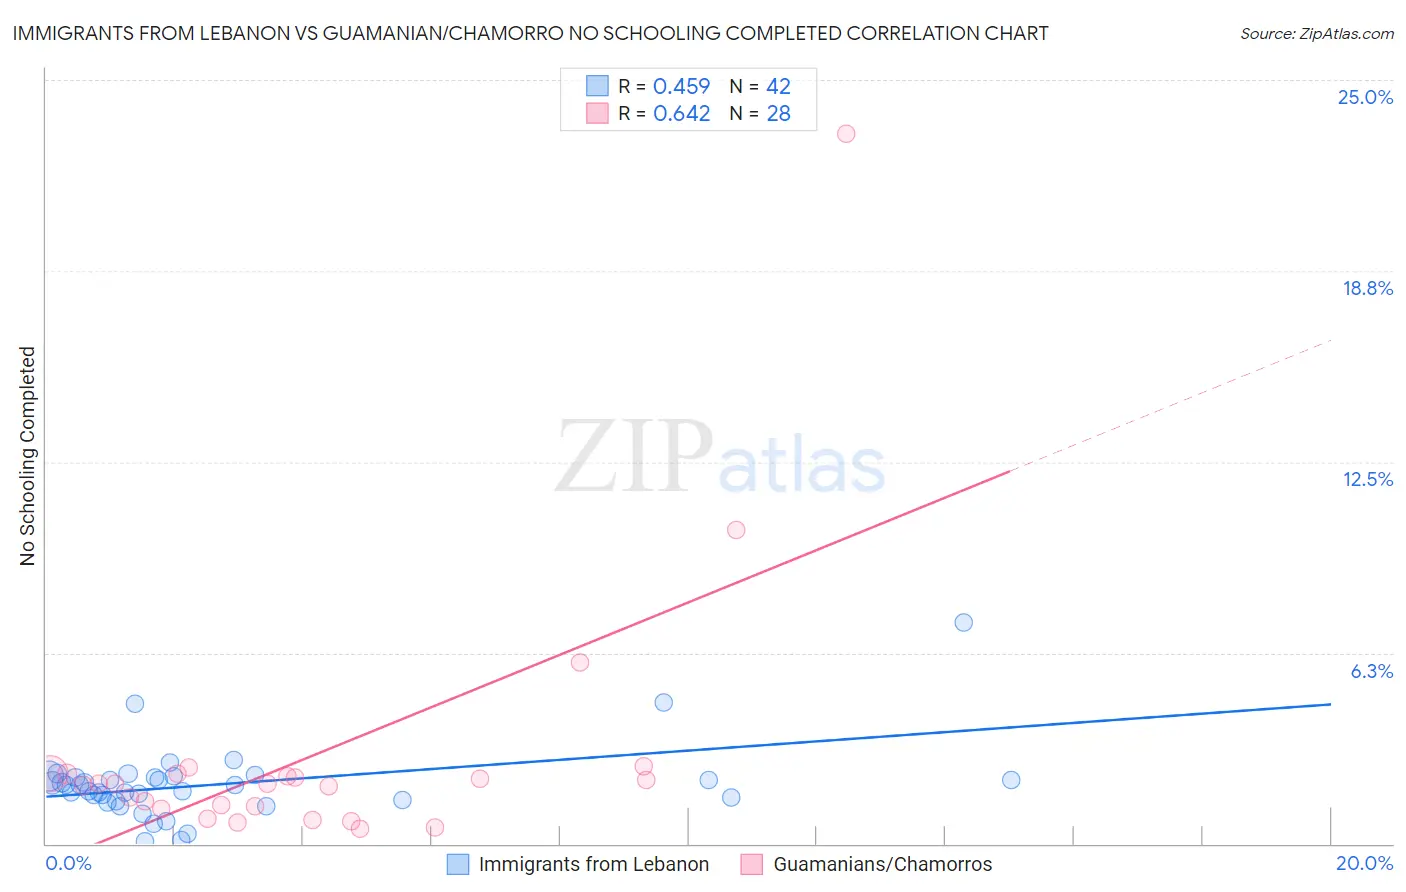
Immigrants from Lebanon vs Guamanian/Chamorro No Schooling Completed Correlation Chart
The statistical analysis conducted on geographies consisting of 216,259,293 people shows a moderate positive correlation between the proportion of Immigrants from Lebanon and percentage of population with no schooling in the United States with a correlation coefficient (R) of 0.459 and weighted average of 2.3%. Similarly, the statistical analysis conducted on geographies consisting of 220,951,365 people shows a significant positive correlation between the proportion of Guamanians/Chamorros and percentage of population with no schooling in the United States with a correlation coefficient (R) of 0.642 and weighted average of 2.2%, a difference of 7.2%.
No Schooling Completed Correlation Summary
| Measurement | Immigrants from Lebanon | Guamanian/Chamorro |
| Minimum | 0.079% | 0.47% |
| Maximum | 7.2% | 23.2% |
| Range | 7.2% | 22.8% |
| Mean | 2.0% | 2.9% |
| Median | 1.9% | 2.0% |
| Interquartile 25% (IQ1) | 1.4% | 1.2% |
| Interquartile 75% (IQ3) | 2.2% | 2.3% |
| Interquartile Range (IQR) | 0.77% | 1.1% |
| Standard Deviation (Sample) | 1.2% | 4.4% |
| Standard Deviation (Population) | 1.2% | 4.3% |
Similar Demographics by No Schooling Completed
Demographics Similar to Immigrants from Lebanon by No Schooling Completed
In terms of no schooling completed, the demographic groups most similar to Immigrants from Lebanon are Subsaharan African (2.3%, a difference of 0.15%), Tohono O'odham (2.3%, a difference of 0.29%), Sudanese (2.3%, a difference of 0.29%), Sierra Leonean (2.3%, a difference of 0.30%), and Immigrants from Sudan (2.3%, a difference of 0.33%).
| Demographics | Rating | Rank | No Schooling Completed |
| Tongans | 6.8 /100 | #216 | Tragic 2.3% |
| Immigrants | Syria | 6.6 /100 | #217 | Tragic 2.3% |
| Immigrants | Nepal | 6.4 /100 | #218 | Tragic 2.3% |
| Senegalese | 5.6 /100 | #219 | Tragic 2.3% |
| Immigrants | Costa Rica | 5.1 /100 | #220 | Tragic 2.3% |
| Immigrants | Sudan | 5.0 /100 | #221 | Tragic 2.3% |
| Sub-Saharan Africans | 4.7 /100 | #222 | Tragic 2.3% |
| Immigrants | Lebanon | 4.5 /100 | #223 | Tragic 2.3% |
| Tohono O'odham | 4.1 /100 | #224 | Tragic 2.3% |
| Sudanese | 4.1 /100 | #225 | Tragic 2.3% |
| Sierra Leoneans | 4.1 /100 | #226 | Tragic 2.3% |
| Immigrants | Uganda | 4.0 /100 | #227 | Tragic 2.3% |
| U.S. Virgin Islanders | 3.7 /100 | #228 | Tragic 2.3% |
| Immigrants | Pakistan | 3.6 /100 | #229 | Tragic 2.3% |
| Puerto Ricans | 3.4 /100 | #230 | Tragic 2.3% |
Demographics Similar to Guamanians/Chamorros by No Schooling Completed
In terms of no schooling completed, the demographic groups most similar to Guamanians/Chamorros are Paraguayan (2.2%, a difference of 0.080%), Bermudan (2.1%, a difference of 0.14%), Immigrants from Albania (2.2%, a difference of 0.24%), Spanish American (2.1%, a difference of 0.43%), and Hawaiian (2.2%, a difference of 0.44%).
| Demographics | Rating | Rank | No Schooling Completed |
| Mongolians | 40.8 /100 | #185 | Average 2.1% |
| Immigrants | Bosnia and Herzegovina | 38.6 /100 | #186 | Fair 2.1% |
| Navajo | 36.5 /100 | #187 | Fair 2.1% |
| Immigrants | Kenya | 36.2 /100 | #188 | Fair 2.1% |
| Immigrants | Egypt | 36.1 /100 | #189 | Fair 2.1% |
| Spanish Americans | 32.6 /100 | #190 | Fair 2.1% |
| Bermudans | 30.7 /100 | #191 | Fair 2.1% |
| Guamanians/Chamorros | 29.8 /100 | #192 | Fair 2.2% |
| Paraguayans | 29.3 /100 | #193 | Fair 2.2% |
| Immigrants | Albania | 28.3 /100 | #194 | Fair 2.2% |
| Hawaiians | 27.0 /100 | #195 | Fair 2.2% |
| Immigrants | Ukraine | 26.1 /100 | #196 | Fair 2.2% |
| Immigrants | Southern Europe | 23.8 /100 | #197 | Fair 2.2% |
| Immigrants | Chile | 22.7 /100 | #198 | Fair 2.2% |
| Africans | 21.8 /100 | #199 | Fair 2.2% |