Immigrants from Cameroon vs Somali Doctorate Degree
COMPARE
Immigrants from Cameroon
Somali
Doctorate Degree
Doctorate Degree Comparison
Immigrants from Cameroon
Somalis
2.0%
DOCTORATE DEGREE
88.9/ 100
METRIC RATING
134th/ 347
METRIC RANK
1.7%
DOCTORATE DEGREE
21.2/ 100
METRIC RATING
204th/ 347
METRIC RANK
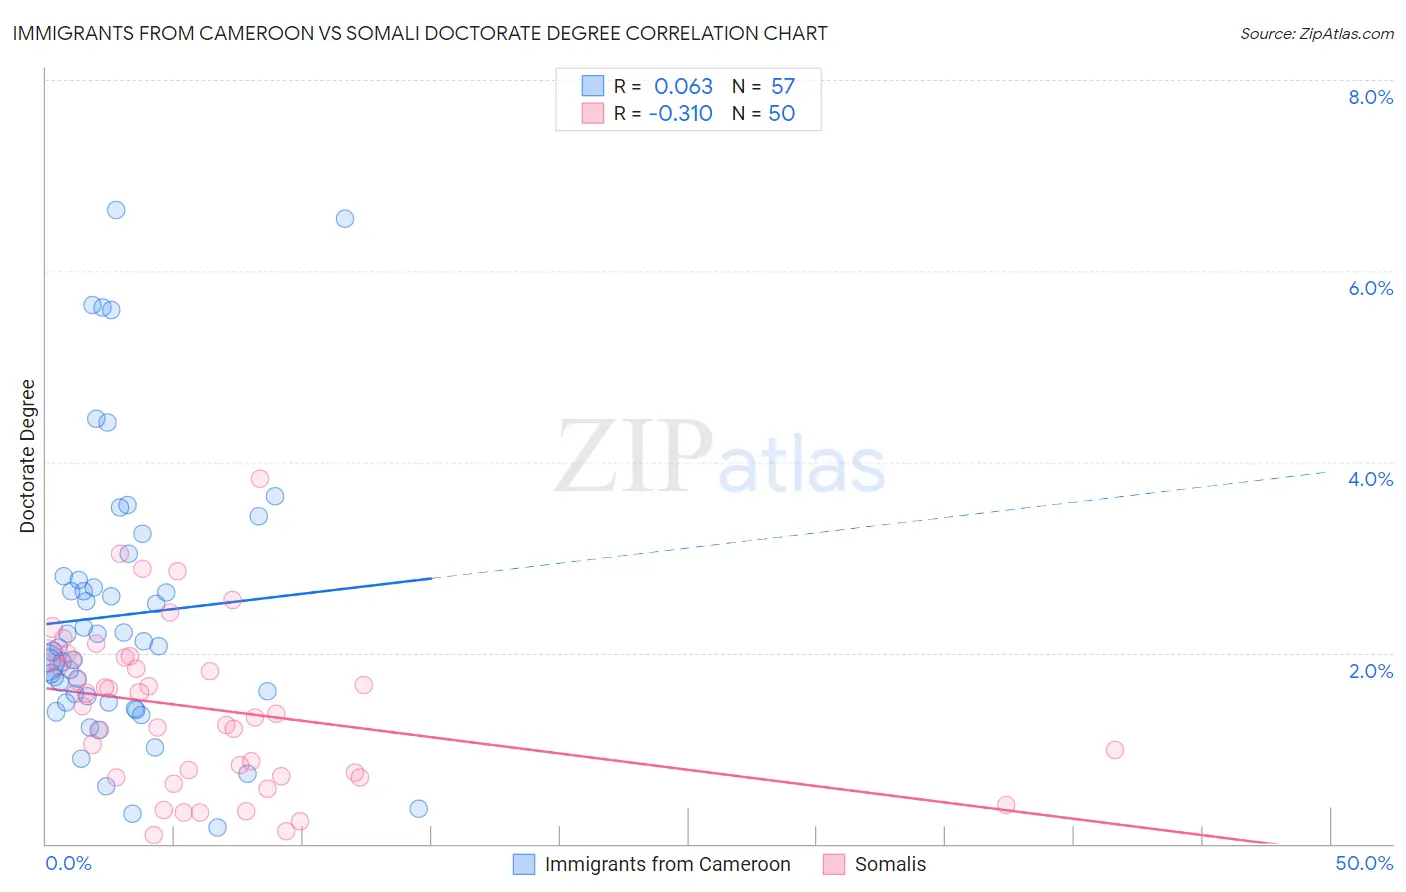
Immigrants from Cameroon vs Somali Doctorate Degree Correlation Chart
The statistical analysis conducted on geographies consisting of 130,429,472 people shows a slight positive correlation between the proportion of Immigrants from Cameroon and percentage of population with at least doctorate degree education in the United States with a correlation coefficient (R) of 0.063 and weighted average of 2.0%. Similarly, the statistical analysis conducted on geographies consisting of 99,087,953 people shows a mild negative correlation between the proportion of Somalis and percentage of population with at least doctorate degree education in the United States with a correlation coefficient (R) of -0.310 and weighted average of 1.7%, a difference of 13.1%.
Doctorate Degree Correlation Summary
| Measurement | Immigrants from Cameroon | Somali |
| Minimum | 0.17% | 0.094% |
| Maximum | 6.6% | 3.8% |
| Range | 6.5% | 3.7% |
| Mean | 2.4% | 1.4% |
| Median | 2.1% | 1.4% |
| Interquartile 25% (IQ1) | 1.5% | 0.70% |
| Interquartile 75% (IQ3) | 2.8% | 1.9% |
| Interquartile Range (IQR) | 1.3% | 1.2% |
| Standard Deviation (Sample) | 1.5% | 0.84% |
| Standard Deviation (Population) | 1.4% | 0.83% |
Similar Demographics by Doctorate Degree
Demographics Similar to Immigrants from Cameroon by Doctorate Degree
In terms of doctorate degree, the demographic groups most similar to Immigrants from Cameroon are Serbian (2.0%, a difference of 0.060%), Immigrants from Uzbekistan (2.0%, a difference of 0.15%), Scottish (2.0%, a difference of 0.20%), Swedish (2.0%, a difference of 0.21%), and South American Indian (2.0%, a difference of 0.21%).
| Demographics | Rating | Rank | Doctorate Degree |
| Palestinians | 92.0 /100 | #127 | Exceptional 2.0% |
| Immigrants | Zaire | 91.1 /100 | #128 | Exceptional 2.0% |
| Canadians | 90.6 /100 | #129 | Exceptional 2.0% |
| Immigrants | Ukraine | 90.5 /100 | #130 | Exceptional 2.0% |
| Immigrants | Sierra Leone | 90.2 /100 | #131 | Exceptional 2.0% |
| Scottish | 89.4 /100 | #132 | Excellent 2.0% |
| Immigrants | Uzbekistan | 89.3 /100 | #133 | Excellent 2.0% |
| Immigrants | Cameroon | 88.9 /100 | #134 | Excellent 2.0% |
| Serbians | 88.7 /100 | #135 | Excellent 2.0% |
| Swedes | 88.3 /100 | #136 | Excellent 2.0% |
| South American Indians | 88.3 /100 | #137 | Excellent 2.0% |
| Swiss | 88.0 /100 | #138 | Excellent 2.0% |
| Afghans | 87.2 /100 | #139 | Excellent 2.0% |
| Immigrants | Africa | 87.0 /100 | #140 | Excellent 2.0% |
| Senegalese | 86.7 /100 | #141 | Excellent 2.0% |
Demographics Similar to Somalis by Doctorate Degree
In terms of doctorate degree, the demographic groups most similar to Somalis are Immigrants from Vietnam (1.8%, a difference of 0.030%), Portuguese (1.8%, a difference of 0.050%), Immigrants from Nigeria (1.8%, a difference of 0.28%), White/Caucasian (1.8%, a difference of 0.35%), and Venezuelan (1.7%, a difference of 0.41%).
| Demographics | Rating | Rank | Doctorate Degree |
| Chinese | 25.1 /100 | #197 | Fair 1.8% |
| Immigrants | Ghana | 24.6 /100 | #198 | Fair 1.8% |
| Immigrants | South America | 23.3 /100 | #199 | Fair 1.8% |
| Whites/Caucasians | 22.8 /100 | #200 | Fair 1.8% |
| Immigrants | Nigeria | 22.4 /100 | #201 | Fair 1.8% |
| Portuguese | 21.4 /100 | #202 | Fair 1.8% |
| Immigrants | Vietnam | 21.4 /100 | #203 | Fair 1.8% |
| Somalis | 21.2 /100 | #204 | Fair 1.7% |
| Venezuelans | 19.5 /100 | #205 | Poor 1.7% |
| Immigrants | Peru | 17.6 /100 | #206 | Poor 1.7% |
| Yugoslavians | 17.1 /100 | #207 | Poor 1.7% |
| Colombians | 16.1 /100 | #208 | Poor 1.7% |
| Immigrants | Western Africa | 15.4 /100 | #209 | Poor 1.7% |
| Tongans | 15.1 /100 | #210 | Poor 1.7% |
| Immigrants | Armenia | 15.1 /100 | #211 | Poor 1.7% |