Cree vs Immigrants from Kuwait Bachelor's Degree
COMPARE
Cree
Immigrants from Kuwait
Bachelor's Degree
Bachelor's Degree Comparison
Cree
Immigrants from Kuwait
33.6%
BACHELOR'S DEGREE
1.0/ 100
METRIC RATING
248th/ 347
METRIC RANK
44.6%
BACHELOR'S DEGREE
99.9/ 100
METRIC RATING
45th/ 347
METRIC RANK
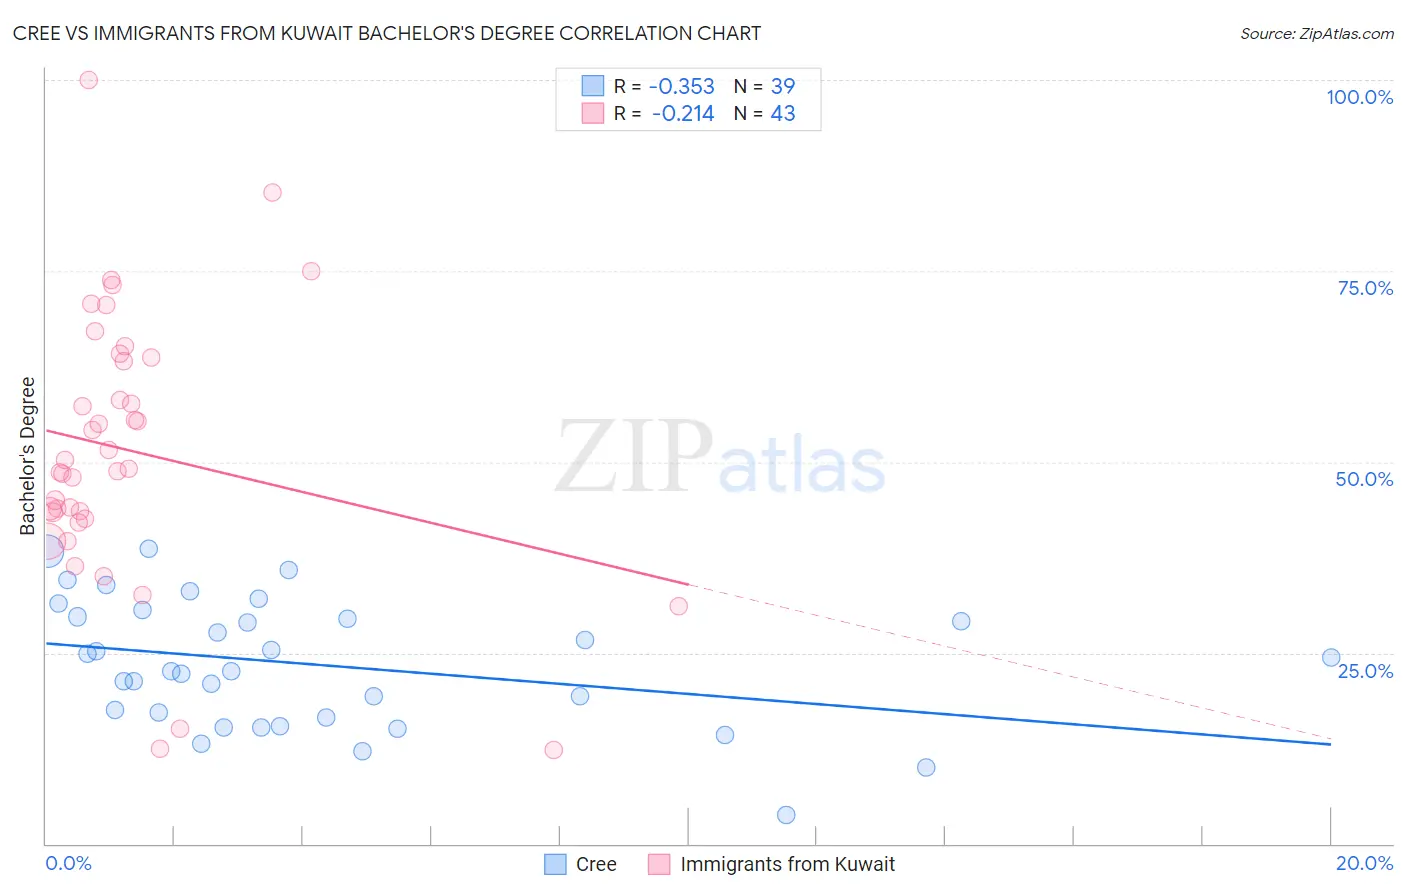
Cree vs Immigrants from Kuwait Bachelor's Degree Correlation Chart
The statistical analysis conducted on geographies consisting of 76,210,625 people shows a mild negative correlation between the proportion of Cree and percentage of population with at least bachelor's degree education in the United States with a correlation coefficient (R) of -0.353 and weighted average of 33.6%. Similarly, the statistical analysis conducted on geographies consisting of 136,917,085 people shows a weak negative correlation between the proportion of Immigrants from Kuwait and percentage of population with at least bachelor's degree education in the United States with a correlation coefficient (R) of -0.214 and weighted average of 44.6%, a difference of 32.8%.
Bachelor's Degree Correlation Summary
| Measurement | Cree | Immigrants from Kuwait |
| Minimum | 3.8% | 12.3% |
| Maximum | 38.7% | 100.0% |
| Range | 34.9% | 87.7% |
| Mean | 23.5% | 51.4% |
| Median | 22.6% | 49.2% |
| Interquartile 25% (IQ1) | 16.6% | 42.5% |
| Interquartile 75% (IQ3) | 29.7% | 63.7% |
| Interquartile Range (IQR) | 13.1% | 21.2% |
| Standard Deviation (Sample) | 8.3% | 17.8% |
| Standard Deviation (Population) | 8.2% | 17.6% |
Similar Demographics by Bachelor's Degree
Demographics Similar to Cree by Bachelor's Degree
In terms of bachelor's degree, the demographic groups most similar to Cree are Immigrants from Congo (33.6%, a difference of 0.010%), Jamaican (33.6%, a difference of 0.10%), Immigrants from Liberia (33.5%, a difference of 0.13%), Indonesian (33.5%, a difference of 0.13%), and Immigrants from Fiji (33.7%, a difference of 0.47%).
| Demographics | Rating | Rank | Bachelor's Degree |
| Immigrants | Cambodia | 1.9 /100 | #241 | Tragic 34.2% |
| Immigrants | Nonimmigrants | 1.8 /100 | #242 | Tragic 34.2% |
| Immigrants | Guyana | 1.4 /100 | #243 | Tragic 33.9% |
| Delaware | 1.2 /100 | #244 | Tragic 33.8% |
| Immigrants | Fiji | 1.2 /100 | #245 | Tragic 33.7% |
| Jamaicans | 1.0 /100 | #246 | Tragic 33.6% |
| Immigrants | Congo | 1.0 /100 | #247 | Tragic 33.6% |
| Cree | 1.0 /100 | #248 | Tragic 33.6% |
| Immigrants | Liberia | 0.9 /100 | #249 | Tragic 33.5% |
| Indonesians | 0.9 /100 | #250 | Tragic 33.5% |
| Japanese | 0.7 /100 | #251 | Tragic 33.3% |
| Immigrants | Bahamas | 0.7 /100 | #252 | Tragic 33.3% |
| U.S. Virgin Islanders | 0.7 /100 | #253 | Tragic 33.2% |
| Native Hawaiians | 0.7 /100 | #254 | Tragic 33.2% |
| Iroquois | 0.7 /100 | #255 | Tragic 33.2% |
Demographics Similar to Immigrants from Kuwait by Bachelor's Degree
In terms of bachelor's degree, the demographic groups most similar to Immigrants from Kuwait are Immigrants from Lithuania (44.6%, a difference of 0.030%), Immigrants from Bulgaria (44.6%, a difference of 0.060%), Bolivian (44.6%, a difference of 0.090%), Estonian (44.6%, a difference of 0.10%), and Immigrants from Norway (44.5%, a difference of 0.22%).
| Demographics | Rating | Rank | Bachelor's Degree |
| Bulgarians | 100.0 /100 | #38 | Exceptional 45.3% |
| Immigrants | Latvia | 100.0 /100 | #39 | Exceptional 45.1% |
| Immigrants | Belarus | 100.0 /100 | #40 | Exceptional 45.0% |
| Immigrants | Malaysia | 100.0 /100 | #41 | Exceptional 45.0% |
| Immigrants | Saudi Arabia | 100.0 /100 | #42 | Exceptional 44.8% |
| Immigrants | South Africa | 99.9 /100 | #43 | Exceptional 44.8% |
| Immigrants | Lithuania | 99.9 /100 | #44 | Exceptional 44.6% |
| Immigrants | Kuwait | 99.9 /100 | #45 | Exceptional 44.6% |
| Immigrants | Bulgaria | 99.9 /100 | #46 | Exceptional 44.6% |
| Bolivians | 99.9 /100 | #47 | Exceptional 44.6% |
| Estonians | 99.9 /100 | #48 | Exceptional 44.6% |
| Immigrants | Norway | 99.9 /100 | #49 | Exceptional 44.5% |
| Immigrants | Greece | 99.9 /100 | #50 | Exceptional 44.5% |
| Asians | 99.9 /100 | #51 | Exceptional 44.4% |
| Immigrants | Spain | 99.9 /100 | #52 | Exceptional 44.3% |